India
A Priority County, Reall has worked in India since 1992, in partnership with SSNS (SPARC Samudaya Nirman Sahayak), Syntellect, and Janaadhar.
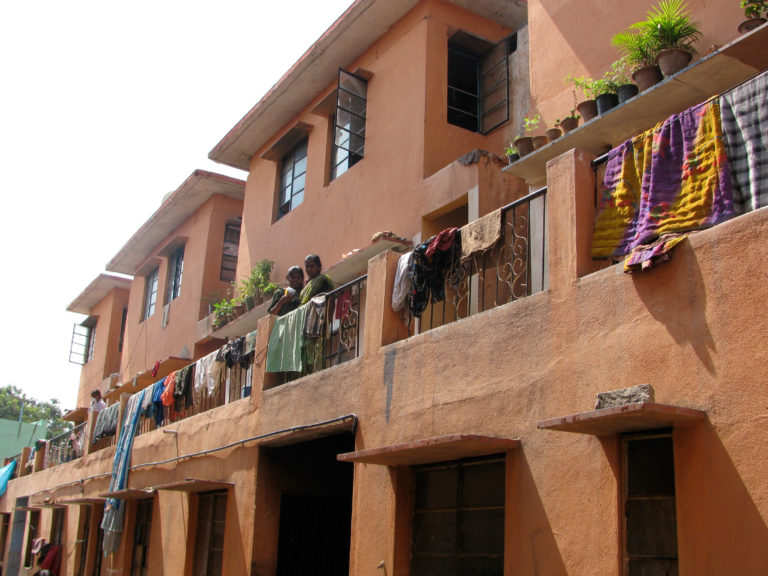
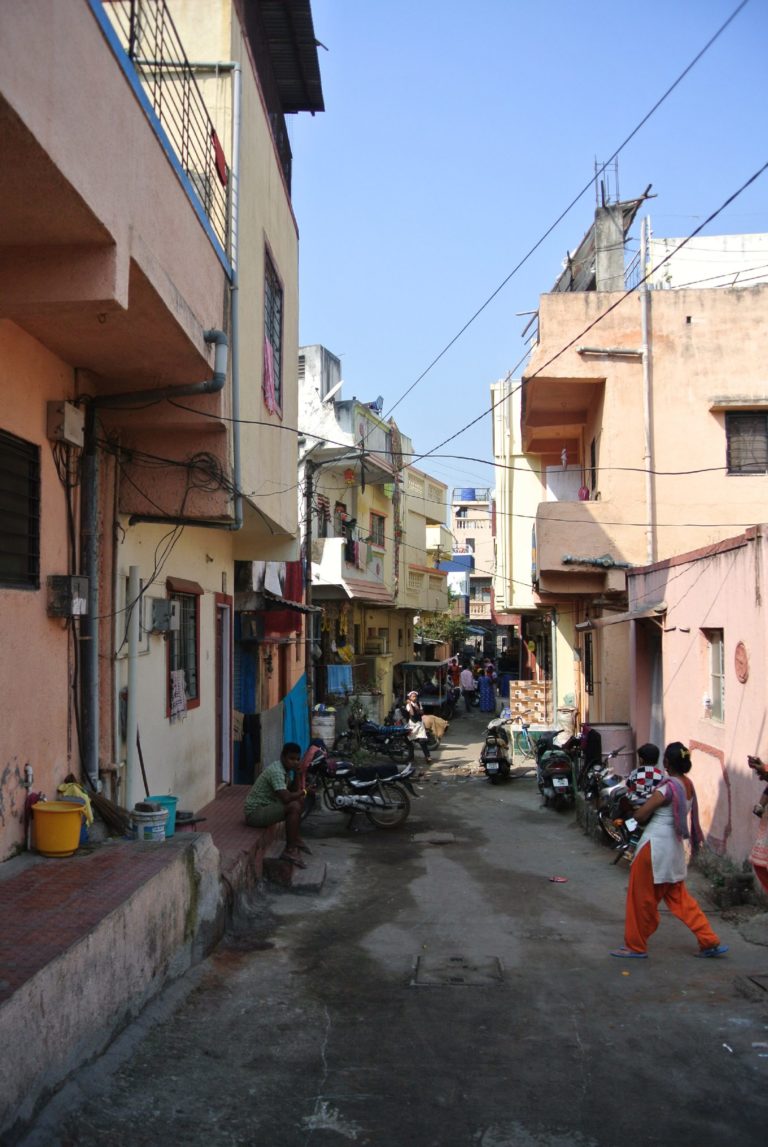
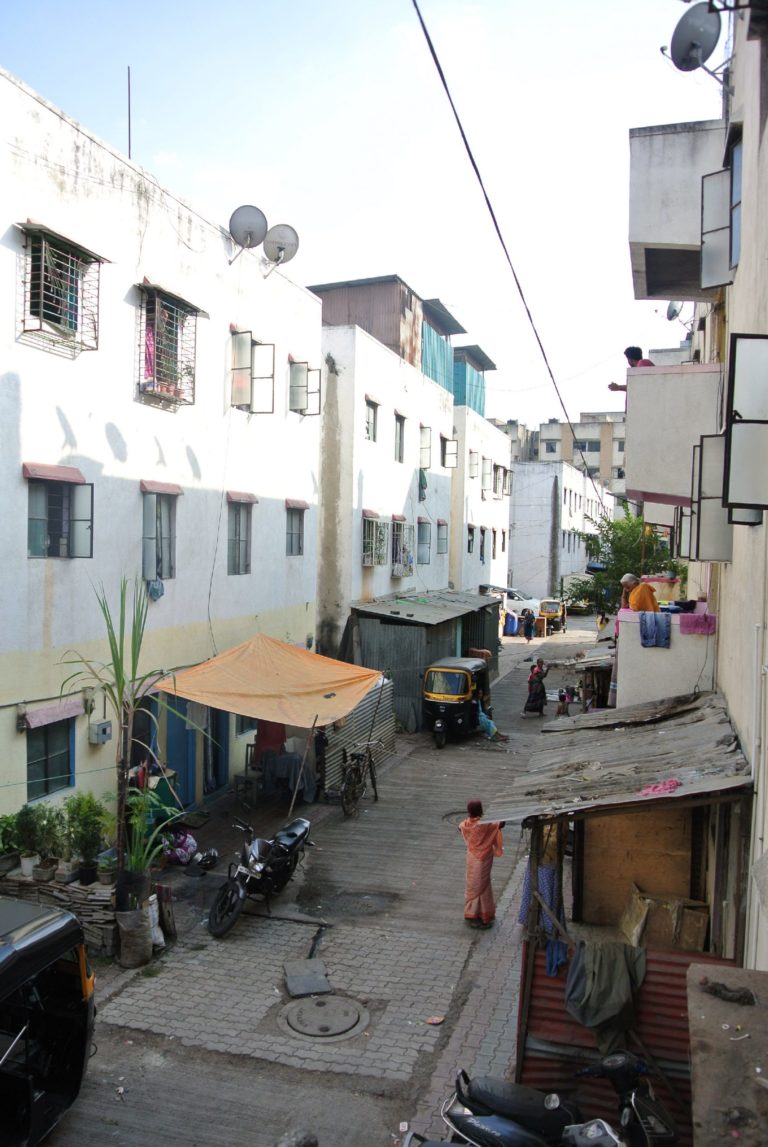
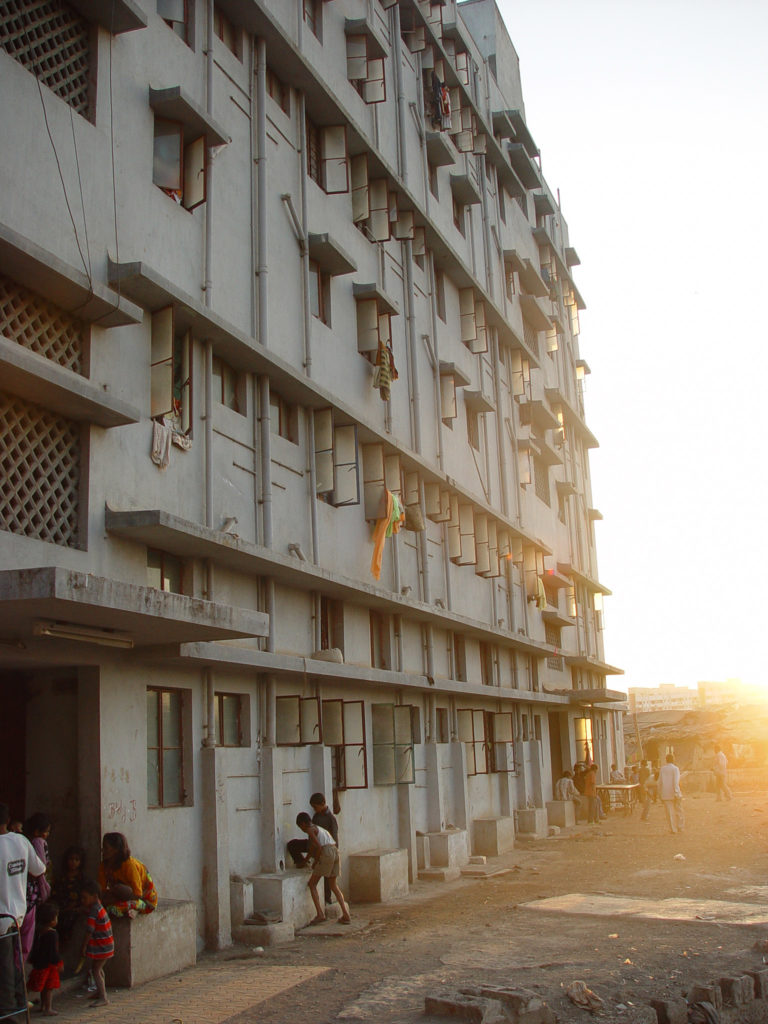
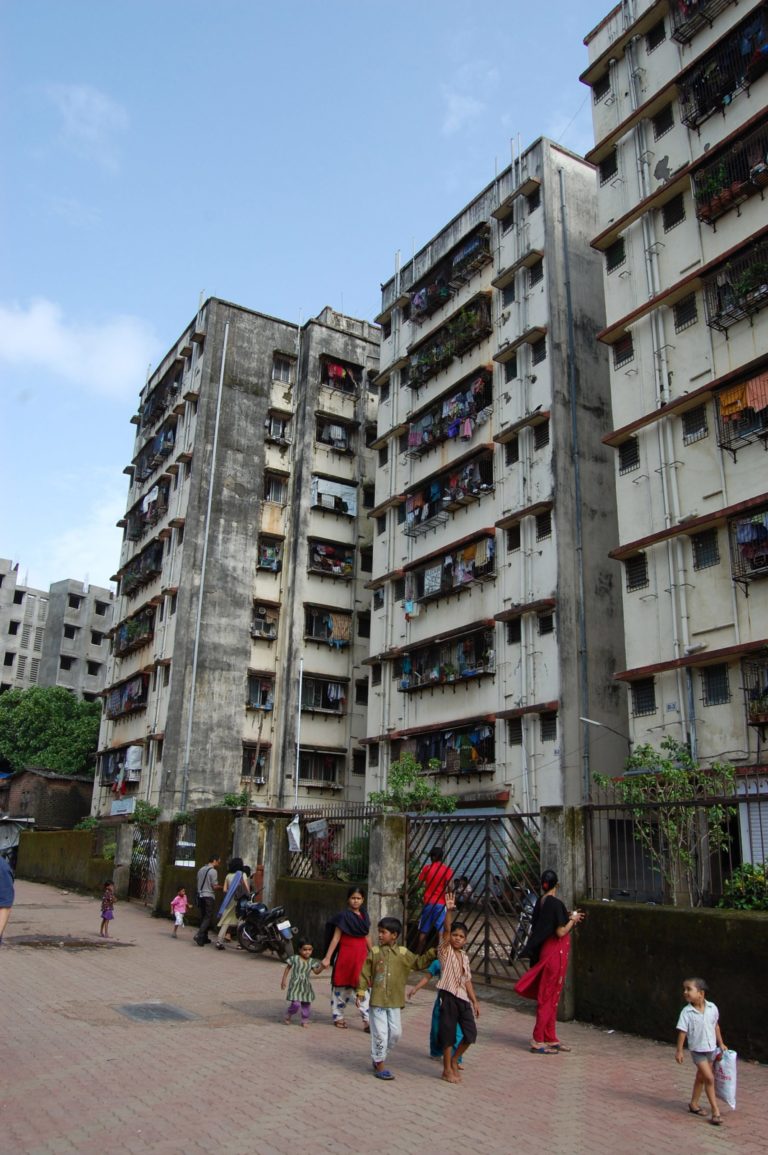
In 2012, the Indian government estimated a housing shortage of more than 19 million homes, of which 95% were in the low-income category; this shortfall is projected to be 30 million by 2030. This escalating gap between demand and supply in the affordable housing segment forces people to live in slums and informal settlements.
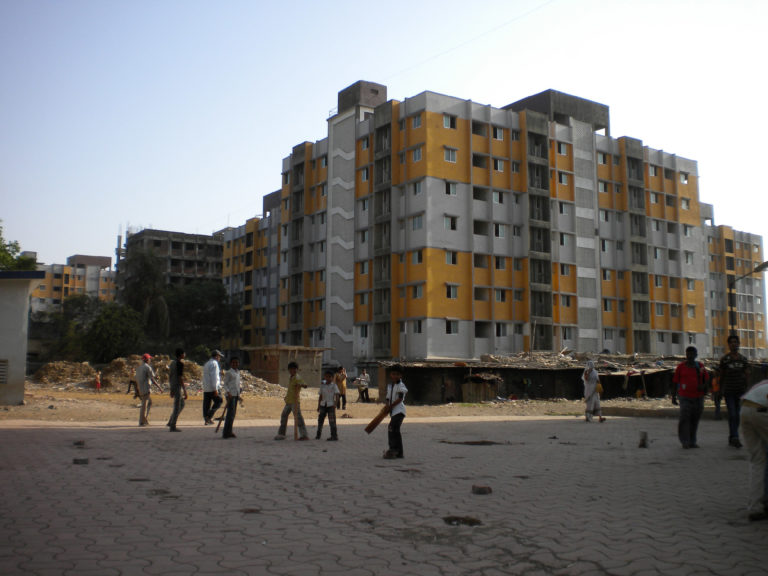
SPARC and its construction arm SPARC Samudaya Nirman Sahayak (SSNS) is Reall’s longest-standing housing partner with collaboration dating back to 1993, resulting in the completion of over 7,000 homes and provision of public and private water and sanitation to over 150,000 households. Reall has provided funds to enable SSNS to utilise various government schemes to subsidise housing projects or recoup costs from the sale of Transferable Development Rights. A key aim of this work is to demonstrate to other developers that affordable housing projects can be commercially viable. Projects include slum upgrading, incremental home repair and upgrading, and construction of new apartment blocks and homes.
Reall’s 2019 collaboration with Syntellect supports scaling access to finance via its RightProfile platform, which helps banks and microfinance institutions assess creditworthiness for unbanked and underbanked populations in India and beyond. By improving risk assessment, the platform aligns with Reall’s broader strategy to make housing finance more accessible, and will link with existing projects such as GAHF which seek to unlock housing finance for low-income households, demonstrating the commercial viability of affordable mortgages across Asia.
Since partnering in 2019, Reall has supported Janaadhar across three initiatives that combine sustainable infrastructure, green construction, and scalable manufacturing. The Sanand project near Ahmedabad is delivering over 800 EDGE-certified one- and two-bedroom apartments featuring central community courtyards, inclusive universal design, solar power, rainwater harvesting, and gravity-fed sewage treatment. With support through the PMAY subsidy, these green and affordable homes are also more accessible to low income people . In Bengaluru, Reall funded ECOSTP DEWATS, a low-energy wastewater treatment system for an upcoming student housing development of over 300 units. Additionally, with support from Reall, Janaadhar’s InstaBuild Precast Factory launched in December 2021. The factory produces modular structural components, and has capacity to build approximately 800 affordable homes per year, offering a replicable and green option for affordable housing at scale
This combined approach, from SSNS’s community-driven builds to Janaadhar’s green, scalable developments and Syntellect’s finance innovation illustrates Reall’s ability to finance affordable, quality housing at scale in India.
Delivery of Homes
Houses
Other Products
Client Data
India Project Finances
Investments — Reall to Affordable Housing Partners
Of INR 1,060,087,592 total investments, INR 111,902,222 was recycled funds from previous project payments
Of $12,660,935 total investments, $1,336,481 was recycled funds from previous project payments
Based on exchange rate on 30/09/2024
Market Shaping Indicators: Key Indicators
1. Land & infrastructure
% of urban bottom 40 households without access to basic sanitation services
| Country | Year | Data Source | Value |
|---|---|---|---|
| Cote d'Ivoire | 2012 | DHS | 96.5% |
| Ghana | 2014 | DHS | 93.15% |
| Kenya | 2014 | DHS | 88.25% |
| Morocco | 2004 | DHS | 52.05% |
| Mozambique | 2011 | DHS | 95.6% |
| Nigeria | 2018 | DHS | 83.1% |
| Tanzania | 2017 | DHS | 37% |
| Uganda | 2016 | DHS | 94.5% |
| Rwanda | 2016 | National Institute of Statistics Rwanda (NISR) | 13.13% |
| Pakistan | 2018 | The DHS Program | 2.75% |
| India | 2018 | NSSO 76th Round | 0.2% |
2. Construction & Investment
% of national population living in slums, informal settlements, or inadequate dwellings
| Country | Year | Data Source | Value |
|---|---|---|---|
| Cote d'Ivoire | N/A | ||
| Ghana | N/A | ||
| Kenya | N/A | ||
| Morocco | N/A | ||
| Mozambique | N/A | ||
| Nigeria | N/A | ||
| Tanzania | N/A | ||
| Uganda | N/A | ||
| Rwanda | 2018 | World Bank | 42.1% |
| Pakistan | N/A | ||
| India | 2018 | NSSO 76th Round | 35% |
3. Sales & Rental
Number of residential mortgages outstanding
| Country | Year | Data Source | Value |
|---|---|---|---|
| Kenya | 2019 | Central Bank of Kenya | 27,993 |
| Nigeria | 2019 | NMRC | 32,260 |
| Tanzania | 2019 | Bank of Tanzania and Tanzania Mortgage Refinance Company Limited | 5,460 |
| Rwanda | 2020 | National Bank of Rwanda (NBR) | 44,177 |
| Pakistan | 2019 | State Bank of Pakistan - Housing Finance Data Review | 58,620 |
| India | 2020 | Reserve Bank of India | 9,817,180 |
3. Sales & Rental
Price of the cheapest, newly built dwelling by a formal developer or contractor
| Country | Year | Data Source | Value |
|---|---|---|---|
| Cote d'Ivoire | 2018 | Site d'annonce et promotion dans l'immobilier en Côte d'Ivoire | 15,500,000 CFA$27,087.48 |
| Ghana | 2019 | Damax Construction Co. Ltd | 108,704 GH₵$19,621.66 |
| Kenya | 2019 | Tsavo Real Estate | 4,000,000 Ksh$37,037.04 |
| Morocco | 2019 | Various real estate websites | 250,000 DH$27,027.03 |
| Mozambique | 2016 | Casa Minha | 3,418,491 MZ$48,147.76 |
| Nigeria | 2019 | Millard Fuller Foundation; Shelter Origins | 2,900,000 NGN$7,651.72 |
| Tanzania | 2018 | CAHF | 37,966,107 TZS$16,508.58 |
| Uganda | 2019 | Various property developers | 125,000,000 UGX$34,097.11 |
| Rwanda | 2020 | Marchal Real Estate Developers | 10,000,000 R₣$11,119.14 |
| Pakistan | 2021 | Partners | 2,500,000 PKR$14,305.33 |
| India | 2022 | Real estate websites and industry experts | 160,000 IN₹$2,176.87 |
3. Sales & Rental
% of national households that rent their dwelling
| Country | Year | Data Source | Value |
|---|---|---|---|
| Ghana | 2017 | Ghana Statistical Service | 28% |
| Kenya | 2019 | Central Bank of Kenya, Kenya National Bureau of Statistics, FSD Kenya | 35.01% |
| Morocco | 2014 | High Commission for Planning; World Bank | 18.5% |
| Nigeria | 2018 | World Bank; Nigeria National Bureau of Statistics | 21.8% |
| Tanzania | 2017 | National Bureau of Statistics | 80.56% |
| Uganda | 2016 | DHS | 53.45% |
| Rwanda | 2020 | Access to Finance Rwanda (AFR) and National Institute of Statistics Rwanda (NISR) | 8.94% |
| Pakistan | 2017 | Population and Housing Census | 11.53% |
| India | 2018 | NSSO 76th Round | 13% |
| Senegal | 2013 | ANSD. (2014). Rapport Définitif du Recensement Général de la Population et de l'Habitat, de l'Agriculture et de l'Elevage. Septembre 2014. data from pages 298 and 323. | 20.1% |
5.Enabling Environment
Ease of Doing Business Index Rank: Global
| Country | Year | Data Source | Value |
|---|---|---|---|
| Cote d'Ivoire | 2020 | World Bank | 110 |
| Ghana | 2020 | World Bank | 118 |
| Kenya | 2019 | World Bank Ease of Doing Business | 61 |
| Morocco | 2020 | World Bank | 53 |
| Mozambique | 2019 | World Bank | 74 |
| Nigeria | 2020 | World Bank | 131 |
| Tanzania | 2020 | World Bank | 141 |
| Uganda | 2020 | World Bank | 116 |
| Rwanda | 2020 | World Bank Ease of Doing Business Indicators | 38 out of 190 |
| Pakistan | 2020 | World Bank Doing Business Indicator | 108 out of 190 |
| India | 2020 | World Bank | 63 out of 190 |
6. Economic Environment
GDP Per Capita
| Country | Year | Data Source | Value |
|---|---|---|---|
| Cote d'Ivoire | 2018 | World Bank | 1,024,171 CFA$1,789.82 |
| Ghana | 2019 | World Bank | 11,489 GH₵$2,073.83 |
| Kenya | 2018 | World Bank | 173,272 Ksh$1,604.37 |
| Morocco | 2018 | World Bank | 30,725 DH$3,321.62 |
| Mozambique | 2018 | World Bank | 30,772 MZ$433.41 |
| Nigeria | 2018 | World Bank | 659,159 NGN$1,739.21 |
| Tanzania | 2018 | National Bureau of Statistics; World Bank | 2,297,020 TZS$998.80 |
| Uganda | 2018 | World Bank | 2,357,327 UGX$643.02 |
| Rwanda | 2019 | World Bank | 737,578.59 R₣$820.12 |
| Pakistan | 2020 | World Bank National Accounts Data | 188,900 PKR$1,080.91 |
| India | 2020 | Ministry of Statistics and Program Implementation | 151,760 IN₹$2,064.76 |
7. Demand
Population Size
| Country | Year | Data Source | Value |
|---|---|---|---|
| Cote d'Ivoire | 2017 | World Bank | 24,437,469 |
| Ghana | 2019 | World Bank | 30,417,856 |
| Kenya | 2017 | World Bank | 50,221,473 |
| Morocco | 2017 | World Bank | 36,471,769 |
| Mozambique | 2018 | World Bank | 29,495,962 |
| Nigeria | 2017 | World Bank | 190,873,311 |
| Tanzania | 2019 | World Bank | 58,005,463 |
| Uganda | 2017 | World Bank | 41,487,000 |
| Rwanda | 2019 | World Bank | 12,626,950 |
| Pakistan | 2020 | World Bank National Accounts Data | 220,892,331 |
| India | 2021 | Minsitry of Health and Family Welfare | 1,361,343,000 |
Documents
Browse Projects in India
Want the latest data?
Be notified each time our data is updated by joining our mailing list.
Want to download this data? Click here to access our data explorer.
Data last updated on 16/10/2025