Pakistan
A priority country, Reall has worked in Pakistan since 1992, primarily in partnership with Ansaar Management Company (AMC) and Modulus Tech.
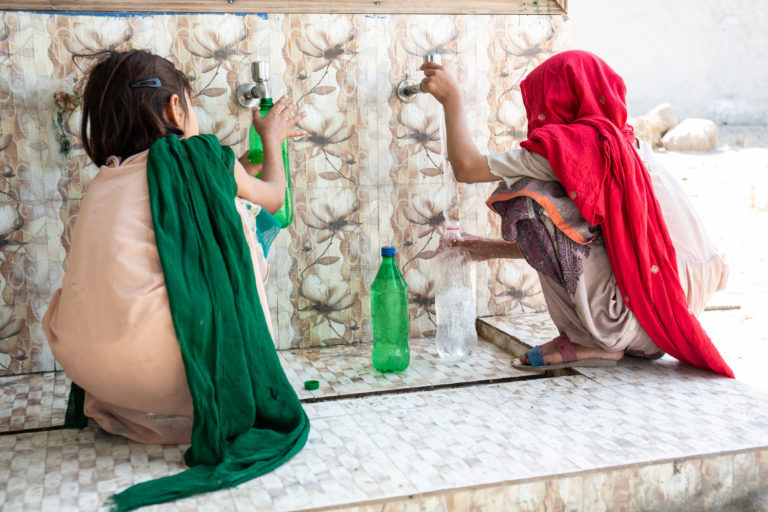
With a housing deficit of over 9 million units and an annual shortfall exceeding 270,000 homes, Pakistan faces a deep and persistent housing crisis. Inflation and rising construction costs continue to push home ownership further out of reach for lower-income households. Access to housing finance remains severely limited, with fewer than 2,000 new mortgages issued annually, most of which go to middle- and high-income earners.
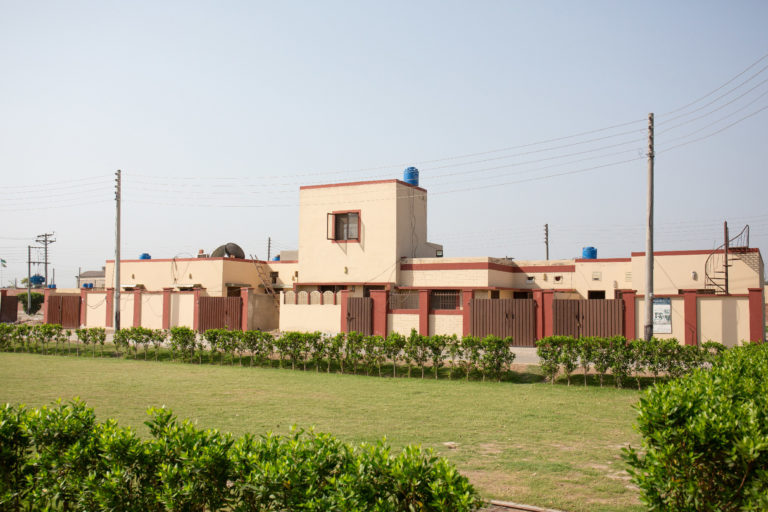
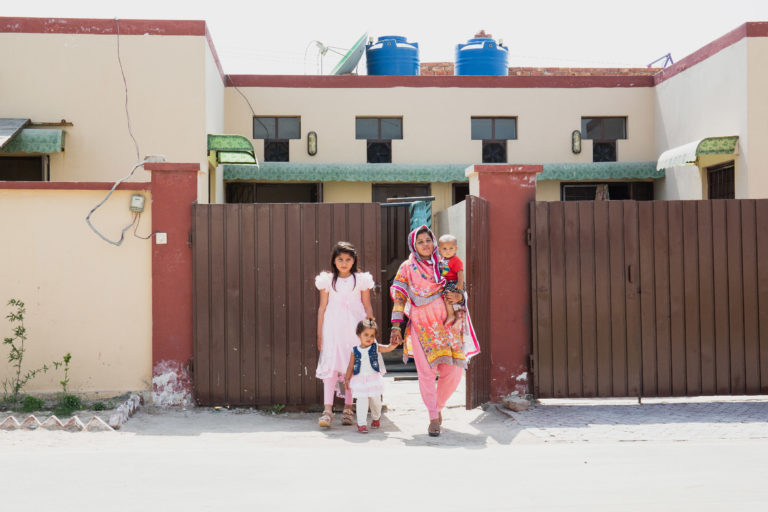
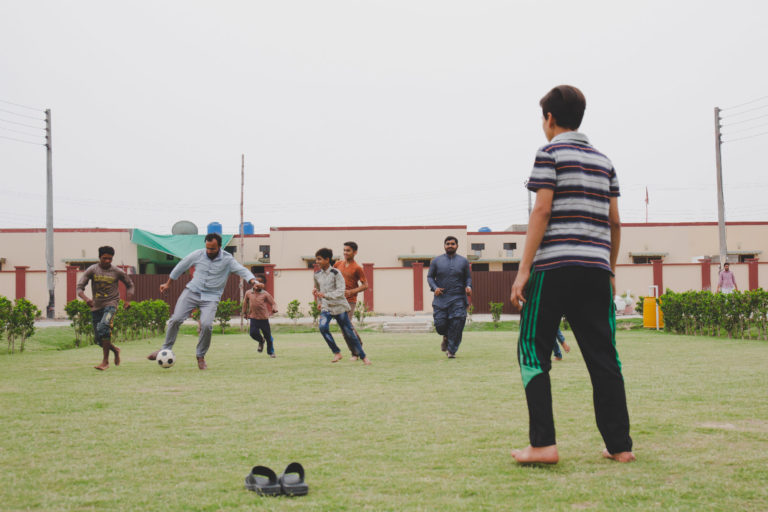
Through AMC, Reall has financed over 750 homes across Faisalabad, Lahore and Peshawar. Not only do AMC deliver innovative modular construction techniques that enhance efficiency, but their developments favour the need for outside space, connected amenities and strong communities. Additionally, AMC have had considerable success in developing agreements with HBFC Bank to provide mortgages for AMC’s clients, to ensure stability and tenure to their residents.
Modulus Tech is an award-winning social enterprise delivering flat-pack, prefabricated eco homes that can be assembled in days. The Zero Carbon Pilot project, funded by Reall, pioneers 10 of the first ever net-zero prefabricated homes in Pakistan that target lower-income households in Karachi. Their pioneering technology reduces carbon emissions by up to 90% per house over its lifetime, surpassing even EDGE Advanced standards, and enables off-grid living with integrated renewable energy and water systems.
These partnerships demonstrate how innovative, climate-smart construction can deliver fast, affordable, and net-zero housing solutions for low-income communities in one of the world’s most housing-stressed markets.
Delivery of Homes
Houses
Other Products
Client Data
Pakistan Project Finances
Investments — Reall to Affordable Housing Partners
Based on exchange rate on 30/09/2024
Market Shaping Indicators: Key Indicators
1. Land and Infrastructure
% of urban bottom 40 households without access to basic sanitation services
| Country | Year | Data Source | Value |
|---|---|---|---|
| Cote d'Ivoire | 2012 | DHS | 96.5% |
| Ghana | 2014 | DHS | 93.15% |
| Kenya | 2014 | DHS | 88.25% |
| Morocco | 2004 | DHS | 52.05% |
| Mozambique | 2011 | DHS | 95.6% |
| Nigeria | 2018 | DHS | 83.1% |
| Tanzania | 2017 | DHS | 37% |
| Uganda | 2016 | DHS | 94.5% |
| Rwanda | 2016 | National Institute of Statistics Rwanda (NISR) | 13.13% |
| Pakistan | 2018 | The DHS Program | 2.75% |
| India | 2018 | NSSO 76th Round | 0.2% |
2. Construction and Investment
% of urban population living in slums, informal settlements, or inadequate dwellings
| Country | Year | Data Source | Value |
|---|---|---|---|
| Cote d'Ivoire | N/A | ||
| Ghana | N/A | ||
| Kenya | N/A | ||
| Morocco | N/A | ||
| Mozambique | N/A | ||
| Nigeria | N/A | ||
| Tanzania | N/A | ||
| Uganda | N/A | ||
| Rwanda | 2018 | World Bank | 42.1% |
| Pakistan | N/A | ||
| India | 2018 | NSSO 76th Round | 35% |
3. Sales and Rental
Number of residential mortgages outstanding
| Country | Year | Data Source | Value |
|---|---|---|---|
| Kenya | 2019 | Central Bank of Kenya | 27,993 |
| Nigeria | 2019 | NMRC | 32,260 |
| Tanzania | 2019 | Bank of Tanzania and Tanzania Mortgage Refinance Company Limited | 5,460 |
| Rwanda | 2020 | National Bank of Rwanda (NBR) | 44,177 |
| Pakistan | 2019 | State Bank of Pakistan - Housing Finance Data Review | 58,620 |
| India | 2020 | Reserve Bank of India | 9,817,180 |
3. Sales and Rental
Price of the cheapest, newly built dwelling by a formal developer or contractor
| Country | Year | Data Source | Value |
|---|---|---|---|
| Cote d'Ivoire | 2018 | Site d'annonce et promotion dans l'immobilier en Côte d'Ivoire | 15,500,000 CFA$27,087.48 |
| Ghana | 2019 | Damax Construction Co. Ltd | 108,704 GH₵$19,621.66 |
| Kenya | 2019 | Tsavo Real Estate | 4,000,000 Ksh$37,037.04 |
| Morocco | 2019 | Various real estate websites | 250,000 DH$27,027.03 |
| Mozambique | 2016 | Casa Minha | 3,418,491 MZ$48,147.76 |
| Nigeria | 2019 | Millard Fuller Foundation; Shelter Origins | 2,900,000 NGN$7,651.72 |
| Tanzania | 2018 | CAHF | 37,966,107 TZS$16,508.58 |
| Uganda | 2019 | Various property developers | 125,000,000 UGX$34,097.11 |
| Rwanda | 2020 | Marchal Real Estate Developers | 10,000,000 R₣$11,119.14 |
| Pakistan | 2021 | Partners | 2,500,000 PKR$14,305.33 |
| India | 2022 | Real estate websites and industry experts | 160,000 IN₹$2,176.87 |
3. Sales and Rental
% of national households that rent their dwelling
| Country | Year | Data Source | Value |
|---|---|---|---|
| Ghana | 2017 | Ghana Statistical Service | 28% |
| Kenya | 2019 | Central Bank of Kenya, Kenya National Bureau of Statistics, FSD Kenya | 35.01% |
| Morocco | 2014 | High Commission for Planning; World Bank | 18.5% |
| Nigeria | 2018 | World Bank; Nigeria National Bureau of Statistics | 21.8% |
| Tanzania | 2017 | National Bureau of Statistics | 80.56% |
| Uganda | 2016 | DHS | 53.45% |
| Rwanda | 2020 | Access to Finance Rwanda (AFR) and National Institute of Statistics Rwanda (NISR) | 8.94% |
| Pakistan | 2017 | Population and Housing Census | 11.53% |
| India | 2018 | NSSO 76th Round | 13% |
| Senegal | 2013 | ANSD. (2014). Rapport Définitif du Recensement Général de la Population et de l'Habitat, de l'Agriculture et de l'Elevage. Septembre 2014. data from pages 298 and 323. | 20.1% |
5. Enabling Environment
Ease of Doing Business Index Rank: Global
| Country | Year | Data Source | Value |
|---|---|---|---|
| Cote d'Ivoire | 2020 | World Bank | 110 |
| Ghana | 2020 | World Bank | 118 |
| Kenya | 2019 | World Bank Ease of Doing Business | 61 |
| Morocco | 2020 | World Bank | 53 |
| Mozambique | 2019 | World Bank | 74 |
| Nigeria | 2020 | World Bank | 131 |
| Tanzania | 2020 | World Bank | 141 |
| Uganda | 2020 | World Bank | 116 |
| Rwanda | 2020 | World Bank Ease of Doing Business Indicators | 38 out of 190 |
| Pakistan | 2020 | World Bank Doing Business Indicator | 108 out of 190 |
| India | 2020 | World Bank | 63 out of 190 |
6. Economic Environment
GDP Per Capita
| Country | Year | Data Source | Value |
|---|---|---|---|
| Cote d'Ivoire | 2018 | World Bank | 1,024,171 CFA$1,789.82 |
| Ghana | 2019 | World Bank | 11,489 GH₵$2,073.83 |
| Kenya | 2018 | World Bank | 173,272 Ksh$1,604.37 |
| Morocco | 2018 | World Bank | 30,725 DH$3,321.62 |
| Mozambique | 2018 | World Bank | 30,772 MZ$433.41 |
| Nigeria | 2018 | World Bank | 659,159 NGN$1,739.21 |
| Tanzania | 2018 | National Bureau of Statistics; World Bank | 2,297,020 TZS$998.80 |
| Uganda | 2018 | World Bank | 2,357,327 UGX$643.02 |
| Rwanda | 2019 | World Bank | 737,578.59 R₣$820.12 |
| Pakistan | 2020 | World Bank National Accounts Data | 188,900 PKR$1,080.91 |
| India | 2020 | Ministry of Statistics and Program Implementation | 151,760 IN₹$2,064.76 |
7. Demand
Population Size
| Country | Year | Data Source | Value |
|---|---|---|---|
| Cote d'Ivoire | 2017 | World Bank | 24,437,469 |
| Ghana | 2019 | World Bank | 30,417,856 |
| Kenya | 2017 | World Bank | 50,221,473 |
| Morocco | 2017 | World Bank | 36,471,769 |
| Mozambique | 2018 | World Bank | 29,495,962 |
| Nigeria | 2017 | World Bank | 190,873,311 |
| Tanzania | 2019 | World Bank | 58,005,463 |
| Uganda | 2017 | World Bank | 41,487,000 |
| Rwanda | 2019 | World Bank | 12,626,950 |
| Pakistan | 2020 | World Bank National Accounts Data | 220,892,331 |
| India | 2021 | Minsitry of Health and Family Welfare | 1,361,343,000 |
Documents
Browse Projects in Pakistan
Want the latest data?
Be notified each time our data is updated by joining our mailing list.
Want to download this data? Click here to access our data explorer.
Data last updated on 16/10/2025