Uganda
Reall has worked in Uganda since 2014, in partnership with Uganda Cooperative Alliance (UCA) and Smart Havens.
Uganda faces a pressing housing challenge, with the country’s housing deficit estimated at over 2.4 million units and continuing to grow by 200,000 units annually. With rapid urbanisation, the majority of new urban residents end up in informal settlements, often without access to adequate services such as clean water, sanitation, and electricity. Despite growing demand, high land costs, limited access to affordable finance, and weak regulatory frameworks make the delivery of decent, affordable housing difficult for lower-income Ugandans.
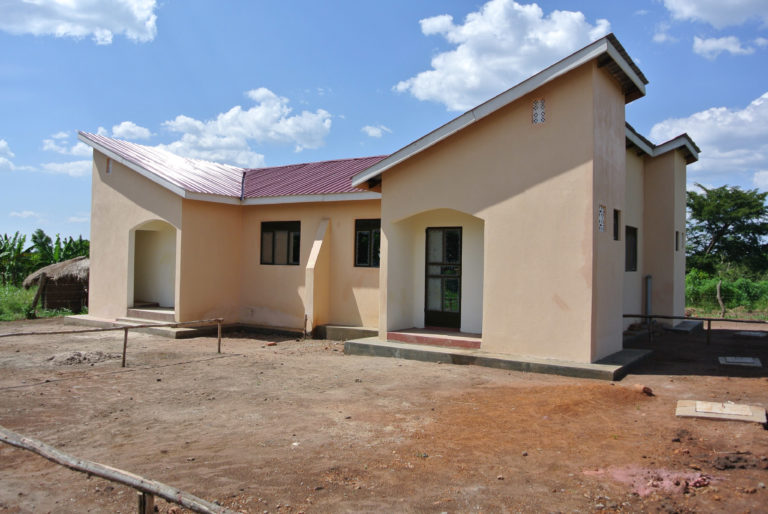
In 2016, Reall partnered with UCA to establish Enterprise Housing Development Uganda (EHDU), aimed at delivering affordable housing to low-income urban households. Their first venture, the Gwengabara project in Lira, delivered four one-bedroom homes alongside 33 serviced plots with freehold titles and access to roads, water, and mains electricity.
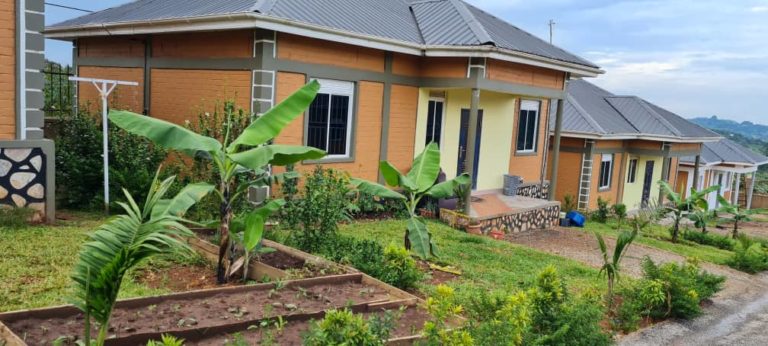
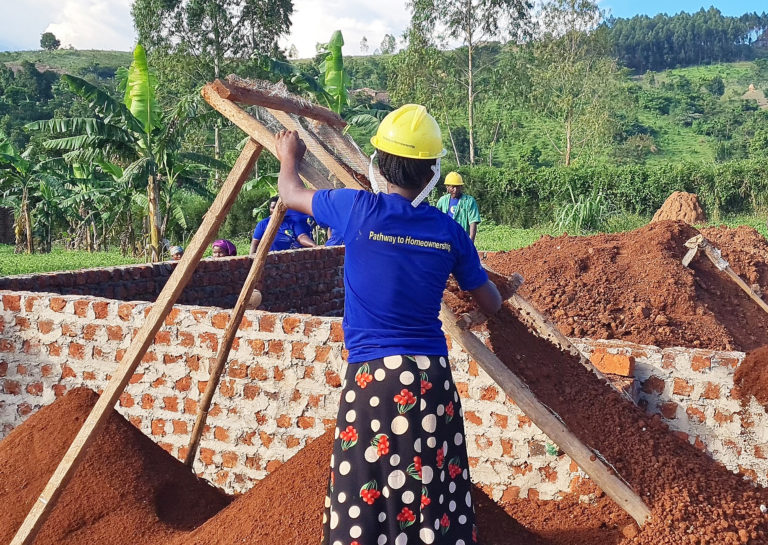
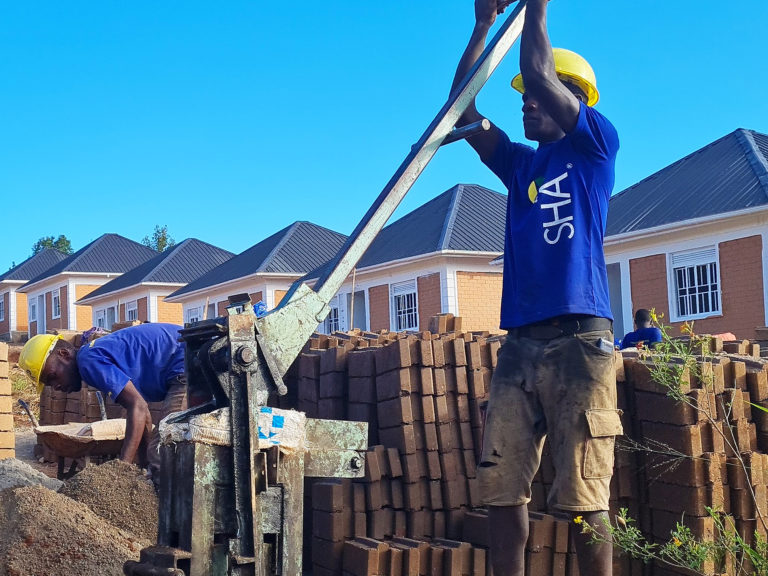
In 2020, Reall entered into a partnership with Smart Havens Africa, a social enterprise delivering climate-smart homes for low-income and female-headed households in Uganda, with a focus on providing legal land ownership, essential services, and employment opportunities for women. Using compressed stabilized earth bricks, their modular homes significantly reduce embodied carbon by approximately 30%. To date, the projects in Kampala (Bukalango and ) have delivered 40+ homes, offering resilient, green housing to underserved populations.
Reall’s work in Uganda shows that combining gender-inclusive, climate-smart housing and cooperative-led developments can effectively start to bridge the housing gap to deliver affordable and resilient homes for underserved communities.
Delivery of Homes
Houses
Other Products
Client Data
Uganda Project Finances
Investments — Reall to Affordable Housing Partners
Based on exchange rate on 30/09/2024
Market Shaping Indicators: Key Indicators
The lack of market intelligence and data is a key constraint undermining private sector participation and good policy engagement in affordable housing.
A joint initiative of the Centre for Affordable Housing Finance in Africa (CAHF) and Reall, the MSIs aim to bridge this gap by making key market data available to all that need it.
1. Land & Infrastructure
% of urban bottom 40 households without access to basic sanitation services
| Country | Year | Data Source | Value |
|---|---|---|---|
| Cote d'Ivoire | 2012 | DHS | 96.5% |
| Ghana | 2014 | DHS | 93.15% |
| Kenya | 2014 | DHS | 88.25% |
| Morocco | 2004 | DHS | 52.05% |
| Mozambique | 2011 | DHS | 95.6% |
| Nigeria | 2018 | DHS | 83.1% |
| Tanzania | 2017 | DHS | 37% |
| Uganda | 2016 | DHS | 94.5% |
| Rwanda | 2016 | National Institute of Statistics Rwanda (NISR) | 13.13% |
| Pakistan | 2018 | The DHS Program | 2.75% |
| India | 2018 | NSSO 76th Round | 0.2% |
2. Construction & Investment
% of urban population living in slums, informal settlements, or inadequate dwellings
| Country | Year | Data Source | Value |
|---|---|---|---|
| Cote d'Ivoire | N/A | ||
| Ghana | N/A | ||
| Kenya | N/A | ||
| Morocco | N/A | ||
| Mozambique | N/A | ||
| Nigeria | N/A | ||
| Tanzania | N/A | ||
| Uganda | N/A | ||
| Rwanda | 2018 | World Bank | 42.1% |
| Pakistan | N/A | ||
| India | 2018 | NSSO 76th Round | 35% |
3. Sales & Rental
Price of the cheapest, newly built dwelling by a formal developer or contractor
| Country | Year | Data Source | Value |
|---|---|---|---|
| Cote d'Ivoire | 2018 | Site d'annonce et promotion dans l'immobilier en Côte d'Ivoire | 15,500,000 CFA$27,087.48 |
| Ghana | 2019 | Damax Construction Co. Ltd | 108,704 GH₵$19,621.66 |
| Kenya | 2019 | Tsavo Real Estate | 4,000,000 Ksh$37,037.04 |
| Morocco | 2019 | Various real estate websites | 250,000 DH$27,027.03 |
| Mozambique | 2016 | Casa Minha | 3,418,491 MZ$48,147.76 |
| Nigeria | 2019 | Millard Fuller Foundation; Shelter Origins | 2,900,000 NGN$7,651.72 |
| Tanzania | 2018 | CAHF | 37,966,107 TZS$16,508.58 |
| Uganda | 2019 | Various property developers | 125,000,000 UGX$34,097.11 |
| Rwanda | 2020 | Marchal Real Estate Developers | 10,000,000 R₣$11,119.14 |
| Pakistan | 2021 | Partners | 2,500,000 PKR$14,305.33 |
| India | 2022 | Real estate websites and industry experts | 160,000 IN₹$2,176.87 |
3. Sales & Rental
% of national households that rent their dwelling
| Country | Year | Data Source | Value |
|---|---|---|---|
| Ghana | 2017 | Ghana Statistical Service | 28% |
| Kenya | 2019 | Central Bank of Kenya, Kenya National Bureau of Statistics, FSD Kenya | 35.01% |
| Morocco | 2014 | High Commission for Planning; World Bank | 18.5% |
| Nigeria | 2018 | World Bank; Nigeria National Bureau of Statistics | 21.8% |
| Tanzania | 2017 | National Bureau of Statistics | 80.56% |
| Uganda | 2016 | DHS | 53.45% |
| Rwanda | 2020 | Access to Finance Rwanda (AFR) and National Institute of Statistics Rwanda (NISR) | 8.94% |
| Pakistan | 2017 | Population and Housing Census | 11.53% |
| India | 2018 | NSSO 76th Round | 13% |
| Senegal | 2013 | ANSD. (2014). Rapport Définitif du Recensement Général de la Population et de l'Habitat, de l'Agriculture et de l'Elevage. Septembre 2014. data from pages 298 and 323. | 20.1% |
5. Enabling Environment
Ease of Doing Business Index Rank: Global
| Country | Year | Data Source | Value |
|---|---|---|---|
| Cote d'Ivoire | 2020 | World Bank | 110 |
| Ghana | 2020 | World Bank | 118 |
| Kenya | 2019 | World Bank Ease of Doing Business | 61 |
| Morocco | 2020 | World Bank | 53 |
| Mozambique | 2019 | World Bank | 74 |
| Nigeria | 2020 | World Bank | 131 |
| Tanzania | 2020 | World Bank | 141 |
| Uganda | 2020 | World Bank | 116 |
| Rwanda | 2020 | World Bank Ease of Doing Business Indicators | 38 out of 190 |
| Pakistan | 2020 | World Bank Doing Business Indicator | 108 out of 190 |
| India | 2020 | World Bank | 63 out of 190 |
6. Economic Environment
GDP Per Capita
| Country | Year | Data Source | Value |
|---|---|---|---|
| Cote d'Ivoire | 2018 | World Bank | 1,024,171 CFA$1,789.82 |
| Ghana | 2019 | World Bank | 11,489 GH₵$2,073.83 |
| Kenya | 2018 | World Bank | 173,272 Ksh$1,604.37 |
| Morocco | 2018 | World Bank | 30,725 DH$3,321.62 |
| Mozambique | 2018 | World Bank | 30,772 MZ$433.41 |
| Nigeria | 2018 | World Bank | 659,159 NGN$1,739.21 |
| Tanzania | 2018 | National Bureau of Statistics; World Bank | 2,297,020 TZS$998.80 |
| Uganda | 2018 | World Bank | 2,357,327 UGX$643.02 |
| Rwanda | 2019 | World Bank | 737,578.59 R₣$820.12 |
| Pakistan | 2020 | World Bank National Accounts Data | 188,900 PKR$1,080.91 |
| India | 2020 | Ministry of Statistics and Program Implementation | 151,760 IN₹$2,064.76 |
7. Demand
Population Size
| Country | Year | Data Source | Value |
|---|---|---|---|
| Cote d'Ivoire | 2017 | World Bank | 24,437,469 |
| Ghana | 2019 | World Bank | 30,417,856 |
| Kenya | 2017 | World Bank | 50,221,473 |
| Morocco | 2017 | World Bank | 36,471,769 |
| Mozambique | 2018 | World Bank | 29,495,962 |
| Nigeria | 2017 | World Bank | 190,873,311 |
| Tanzania | 2019 | World Bank | 58,005,463 |
| Uganda | 2017 | World Bank | 41,487,000 |
| Rwanda | 2019 | World Bank | 12,626,950 |
| Pakistan | 2020 | World Bank National Accounts Data | 220,892,331 |
| India | 2021 | Minsitry of Health and Family Welfare | 1,361,343,000 |
Browse Projects in Uganda
Want the latest data?
Be notified each time our data is updated by joining our mailing list.
Want to download this data? Click here to access our data explorer.
Data last updated on 16/10/2025