Ghana
Reall has worked in Ghana since 2014, in partnership with Afreh group.
Ghana continues to experience rapid urban growth, with a significant portion of the population living in informal, substandard housing that is overcrowded and lacks basic infrastructure, such as water, electricity and waste management. In addition, the housing deficit has contributed to rising property and rental prices, pushing many low-income families into substandard living conditions and deepening socio-economic inequality
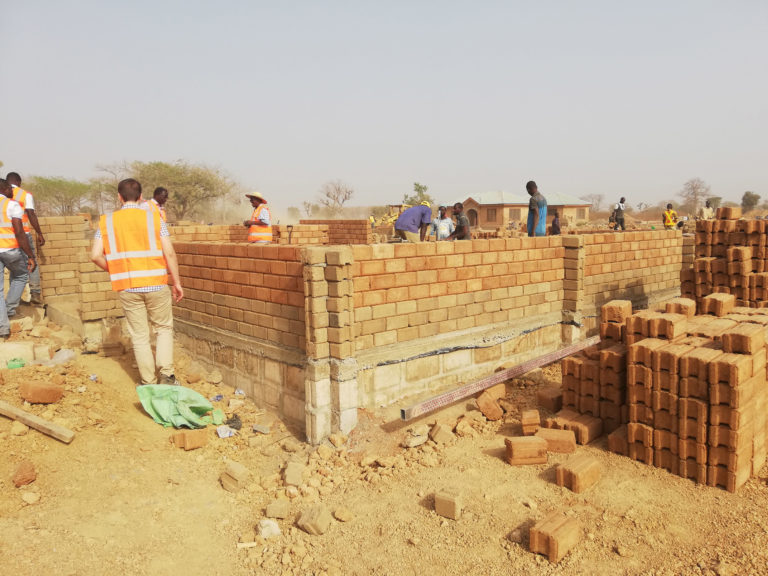
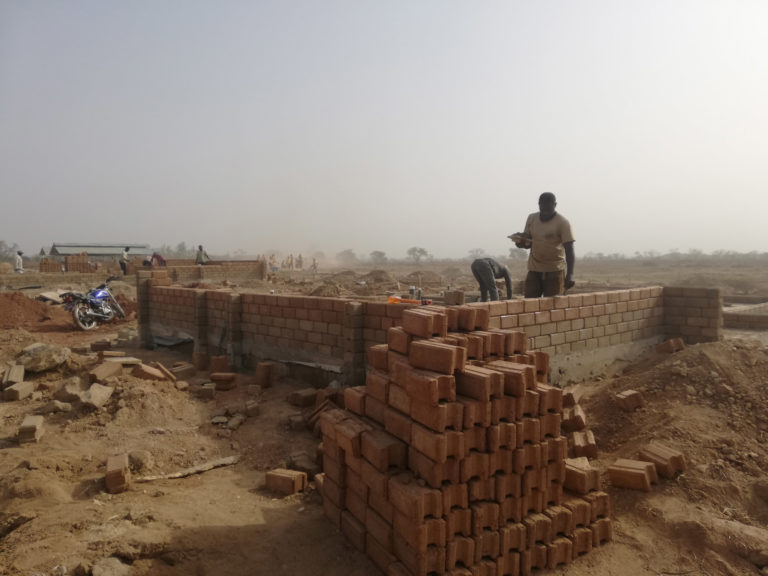
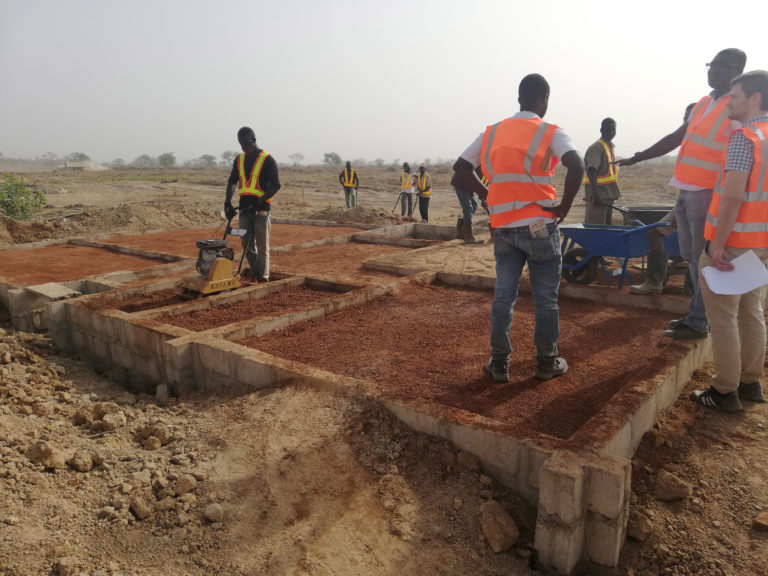
In response, Reall supported an affordable housing development in Tamale, the capital of Ghana’s Northern Region. Delivered by private developer Afreh Group, the project provides 100 fully serviced homes for low-income members of the Tamale Community Cooperative Credit Union. Situated on 12 hectares of land just 10 km from the city centre, the site benefits from existing service access and is located near schools, markets, and other amenities. The houses are designed to be incrementally expandable, giving homeowners the option to extend their homes over time according to their needs and financial capacity. Upon completion, this estate became the first EDGE certified project in the Reall network.
This project in Tamale represents a replicable, community-driven model for delivering dignified, affordable housing in Ghana’s rapidly urbanising regions.
Delivery of Homes
Houses
Ghana Project Finances
Investments — Reall to Affordable Housing Partners
Based on exchange rate on 30/09/2024
Market Shaping Indicators: Key Indicators
The lack of market intelligence and data is a key constraint undermining private sector participation and good policy engagement in affordable housing.
A joint initiative of the Centre for Affordable Housing Finance in Africa (CAHF) and Reall, the MSIs aim to bridge this gap by making key market data available to all that need it.
1. Land & Infrastructure
% of urban bottom 40 households without access to basic sanitation services
| Country | Year | Data Source | Value |
|---|---|---|---|
| Cote d'Ivoire | 2012 | DHS | 96.5% |
| Ghana | 2014 | DHS | 93.15% |
| Kenya | 2014 | DHS | 88.25% |
| Morocco | 2004 | DHS | 52.05% |
| Mozambique | 2011 | DHS | 95.6% |
| Nigeria | 2018 | DHS | 83.1% |
| Tanzania | 2017 | DHS | 37% |
| Uganda | 2016 | DHS | 94.5% |
| Rwanda | 2016 | National Institute of Statistics Rwanda (NISR) | 13.13% |
| Pakistan | 2018 | The DHS Program | 2.75% |
| India | 2018 | NSSO 76th Round | 0.2% |
2. Construction & Investment
% of urban population living in slums, informal settlements, or inadequate dwellings
| Country | Year | Data Source | Value |
|---|---|---|---|
| Cote d'Ivoire | N/A | ||
| Ghana | N/A | ||
| Kenya | N/A | ||
| Morocco | N/A | ||
| Mozambique | N/A | ||
| Nigeria | N/A | ||
| Tanzania | N/A | ||
| Uganda | N/A | ||
| Rwanda | 2018 | World Bank | 42.1% |
| Pakistan | N/A | ||
| India | 2018 | NSSO 76th Round | 35% |
3. Sales & Rental
Price of the cheapest, newly built dwelling by a formal developer or contractor
| Country | Year | Data Source | Value |
|---|---|---|---|
| Cote d'Ivoire | 2018 | Site d'annonce et promotion dans l'immobilier en Côte d'Ivoire | 15,500,000 CFA$27,087.48 |
| Ghana | 2019 | Damax Construction Co. Ltd | 108,704 GH₵$19,621.66 |
| Kenya | 2019 | Tsavo Real Estate | 4,000,000 Ksh$37,037.04 |
| Morocco | 2019 | Various real estate websites | 250,000 DH$27,027.03 |
| Mozambique | 2016 | Casa Minha | 3,418,491 MZ$48,147.76 |
| Nigeria | 2019 | Millard Fuller Foundation; Shelter Origins | 2,900,000 NGN$7,651.72 |
| Tanzania | 2018 | CAHF | 37,966,107 TZS$16,508.58 |
| Uganda | 2019 | Various property developers | 125,000,000 UGX$34,097.11 |
| Rwanda | 2020 | Marchal Real Estate Developers | 10,000,000 R₣$11,119.14 |
| Pakistan | 2021 | Partners | 2,500,000 PKR$14,305.33 |
| India | 2022 | Real estate websites and industry experts | 160,000 IN₹$2,176.87 |
3. Sales & Rental
% of national households that rent their dwelling
| Country | Year | Data Source | Value |
|---|---|---|---|
| Ghana | 2017 | Ghana Statistical Service | 28% |
| Kenya | 2019 | Central Bank of Kenya, Kenya National Bureau of Statistics, FSD Kenya | 35.01% |
| Morocco | 2014 | High Commission for Planning; World Bank | 18.5% |
| Nigeria | 2018 | World Bank; Nigeria National Bureau of Statistics | 21.8% |
| Tanzania | 2017 | National Bureau of Statistics | 80.56% |
| Uganda | 2016 | DHS | 53.45% |
| Rwanda | 2020 | Access to Finance Rwanda (AFR) and National Institute of Statistics Rwanda (NISR) | 8.94% |
| Pakistan | 2017 | Population and Housing Census | 11.53% |
| India | 2018 | NSSO 76th Round | 13% |
| Senegal | 2013 | ANSD. (2014). Rapport Définitif du Recensement Général de la Population et de l'Habitat, de l'Agriculture et de l'Elevage. Septembre 2014. data from pages 298 and 323. | 20.1% |
5. Enabling Environment
Ease of Doing Business Index Rank: Global
| Country | Year | Data Source | Value |
|---|---|---|---|
| Cote d'Ivoire | 2020 | World Bank | 110 |
| Ghana | 2020 | World Bank | 118 |
| Kenya | 2019 | World Bank Ease of Doing Business | 61 |
| Morocco | 2020 | World Bank | 53 |
| Mozambique | 2019 | World Bank | 74 |
| Nigeria | 2020 | World Bank | 131 |
| Tanzania | 2020 | World Bank | 141 |
| Uganda | 2020 | World Bank | 116 |
| Rwanda | 2020 | World Bank Ease of Doing Business Indicators | 38 out of 190 |
| Pakistan | 2020 | World Bank Doing Business Indicator | 108 out of 190 |
| India | 2020 | World Bank | 63 out of 190 |
6. Economic Environment
GDP Per Capita
| Country | Year | Data Source | Value |
|---|---|---|---|
| Cote d'Ivoire | 2018 | World Bank | 1,024,171 CFA$1,789.82 |
| Ghana | 2019 | World Bank | 11,489 GH₵$2,073.83 |
| Kenya | 2018 | World Bank | 173,272 Ksh$1,604.37 |
| Morocco | 2018 | World Bank | 30,725 DH$3,321.62 |
| Mozambique | 2018 | World Bank | 30,772 MZ$433.41 |
| Nigeria | 2018 | World Bank | 659,159 NGN$1,739.21 |
| Tanzania | 2018 | National Bureau of Statistics; World Bank | 2,297,020 TZS$998.80 |
| Uganda | 2018 | World Bank | 2,357,327 UGX$643.02 |
| Rwanda | 2019 | World Bank | 737,578.59 R₣$820.12 |
| Pakistan | 2020 | World Bank National Accounts Data | 188,900 PKR$1,080.91 |
| India | 2020 | Ministry of Statistics and Program Implementation | 151,760 IN₹$2,064.76 |
7. Demand
Population Size
| Country | Year | Data Source | Value |
|---|---|---|---|
| Cote d'Ivoire | 2017 | World Bank | 24,437,469 |
| Ghana | 2019 | World Bank | 30,417,856 |
| Kenya | 2017 | World Bank | 50,221,473 |
| Morocco | 2017 | World Bank | 36,471,769 |
| Mozambique | 2018 | World Bank | 29,495,962 |
| Nigeria | 2017 | World Bank | 190,873,311 |
| Tanzania | 2019 | World Bank | 58,005,463 |
| Uganda | 2017 | World Bank | 41,487,000 |
| Rwanda | 2019 | World Bank | 12,626,950 |
| Pakistan | 2020 | World Bank National Accounts Data | 220,892,331 |
| India | 2021 | Minsitry of Health and Family Welfare | 1,361,343,000 |
Browse Projects in Ghana
Want the latest data?
Be notified each time our data is updated by joining our mailing list.
Want to download this data? Click here to access our data explorer.
Data last updated on 16/10/2025