Understanding the tenants of Kwangu Kwako Ltd’s rental properties in Nairobi, Kenya
The following article is co-written by Ben Atkinson, Programme Lead – Data and Evidence at Reall and Beatrice Mwangi, Research Manager at the Centre for Affordable Housing Finance in Africa as part of their partnership under the Data Agenda for Housing in Africa. This blog was followed by a similar analysis of occupants of a Fusion Capital project, which can be found here.
So much research and analysis in affordable housing goes into the supply side, to understand building quality, costs, and the delivery process. On the demand side, we assume that affordable housing has the potential to be truly transformative for lower-income households, positively impacting on a huge range of areas including health, education, poverty and wellbeing. However, too few housing projects successfully track the experiences of their residents.
Under the Open Access Initiative, Reall, FSD Kenya, and the Centre for Affordable Housing Finance in Africa (CAHF), have been working together to round out our understanding of affordable housing, by looking at the demand side as well as at the supply side. Working with FSD Kenya’s and Reall’s partners, Kwangu Kwaku Limited and Fusion Capital, we’ve explored the experiences of their tenants against an analysis of tenants in urban Kenya from 2019 census data [1].
This article focuses on tenants in homes delivered by Kwangu Kwaku Ltd (KKL), summarising results from 50 baseline surveys (66% from female and 34% from male respondents). With only 50 responses, it does not effectively profile low-income households; the sample is entirely inadequate for this. However, it does give a useful indication of the types of clients that KKL is reaching.
KKL is a Kenyan Company that manufactures and builds using off-site modular solutions for residential and other uses. The units comprise precast concrete panels and fabricated metal components. They have several projects in Athi River, Kitengela, Kawangware, Kibera, Kangemi and Ngong, where they construct units, primarily for small-scale investors seeking to offer accommodation for rent.
With homeownership at only 21.3%, the Nairobi housing market is predominantly rental, with an estimated 75% of the employed population earning below Kshs 50,000 (US$ 440) per month[2]. These projects target this under-served mass market. The units are built for small scale landlords who then rent them out primarily for residential use to low-income tenants.
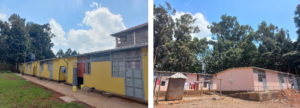
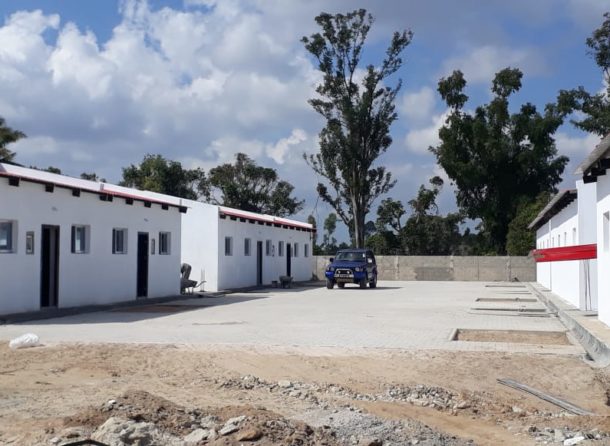
Fig 1: The Kwangu Kwako Limited (KKL) projects in Kawangware comprise of 17m2 studios renting for Kshs 9,000-10,000 (USD 67-75) per month. The projects are owned by two small landlords and KKL does the construction using precast concrete panels and fabricated metal components. Kawangware is a unique settlement within Nairobi, in that residents hold title to their land. The area includes a mix of single and multi-storey walk-ups as well as less formal settlements.
Household demographics
KKL’s homes serve small, young households; 70% of tenants are aged 21-30 years, and 46% reported being married. The average household size is 2.4 people. Of the 120 people reported to be living in the 50 homes, 47% are women and girls, 68% are adults aged 18-64 years and 33% are children.
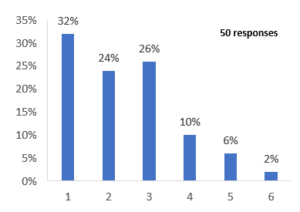
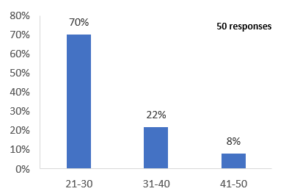
Fig 2: Household size (no. people) Fig 3: Age of lead tenants (years)
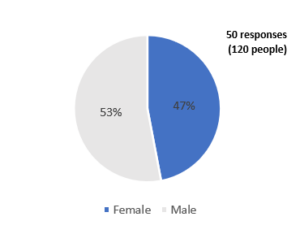
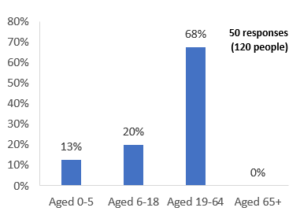
Fig 4: Reported gender of all residents Fig 5: Age groups of all residents
With 78% reporting education to Secondary level or higher (69% female, 94% male), KKL tenants are more educated than Kenya urban tenants as a whole (55%) [3], perhaps related to the young age of KKL tenants.
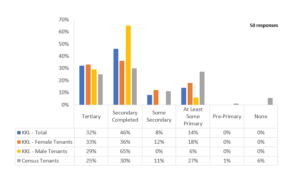
Fig 6: Highest level of education
Employment and income
Employment data can be compared with census data, though imperfectly due to the different terminology used [4]. KKL data broadly matched the census for formal/public or private employment, and for business owners, but differed significantly for informal/casual or seasonal employment (28% KKL, 10% census) and those out of work (10% KKL, 26% census) [5].
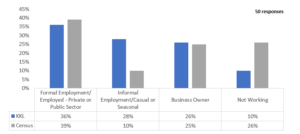
Fig 7: Employment type
Residents work in a broad range of occupations, with the most common being generally blue-collar roles such as mechanics (4 cases), labourers (4 cases), security (2 cases) and taxi drivers (2 cases), but also various more white-collar roles including in IT (2 cases), administration (2 cases), finance (2 cases) and accounting (1 case), and customer service (2 cases).
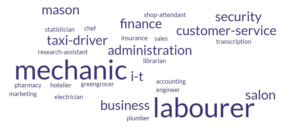
Fig 8: Occupations
Reliable data on personal and household incomes is always challenging to capture, and KKL residents were particularly concerned over the provision of income data. As such, the data collected is likely not representative and has not been included within this article. Expenditure data was less contentious, so has continued to be utilised and can provide an idea of incomes, strongly suggesting the households generally skew towards the lower end of the income pyramid [6]. However, it is important to highlight that expenditure data was captured by type and does not include all household expenditure.
In 76% of cases the main income earner’s job or business was the only income source for the household. Of the 12 respondents that reported an additional income source, four respondents said this was from another household member’s job or business, one said the additional income was from a smallholding, and the remaining seven cases chose not to elaborate.
Previous living conditions
Most respondents (66%) were not born in Nairobi and arrived in the city only in the past 10 years. A significant minority (46%) retain ownership of a home in their ancestral village. Though in two cases the respondents’ spouse and/or children continue to live in these homes, generally they are either occupied by other family members (57%) or are left partially or entirely unoccupied (35%).
In the vast majority of cases, respondents were tenants in their previous homes, either with sole (64%) or shared (28%) occupancy. These were generally less formalised rentals with 61% stating that there was no written tenancy agreement. Another 20% were unsure. This changed substantially when moving to their current homes built by KKL; the majority of respondents report that they are now listed on their tenancy agreement, though this remains more likely for men – 94% of adult male tenants reported that they were either the only signatory or a joint signatory to the tenancy agreement, compared with 73% of adult females.
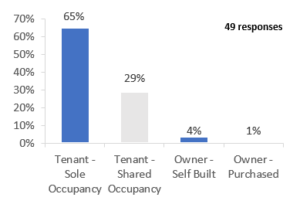
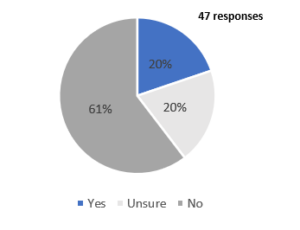
Fig 9: Previous occupancy status Fig 10: Existence of written tenancy agreement for previous home
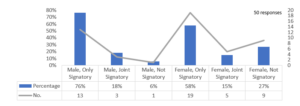
Fig 11: Signatories of tenancy agreement for new home
Respondents’ new homes are concrete-walled studio or one-bed homes with in-house taps and flush toilets. Respondents’ previous homes were generally a similar size, with 68% living in a single room. They appear to have also generally been permanent structures, with walls made of bricks, stone or concrete (though 18% of respondents reported that their previous home used metal sheets or wood for walls). However, only 48% of respondents had in-home sanitation in their previous home, with the rest mainly sharing with neighbours. Numbers are similar for taps, with 43% of respondents previously having in-home taps, another 8% having a private tap on their plot, and the rest sharing or using communal sources.
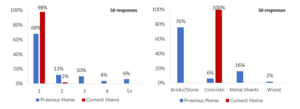
Fig 12: Number of rooms in previous vs current home Fig 13: Main wall material in previous vs current home
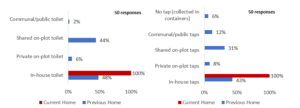
Fig 14: Sanitation provision in previous vs current home Fig 15: Water tap provision in previous vs current home
Previous Expenditure
Respondents were asked to list their average expenditure against key categories in their previous home. Caution is required in using this data (particularly for those with the lowest total expenditures), but Fig 16 shows proportion of monthly expenditure by category for each household, ordered by total expenditure.
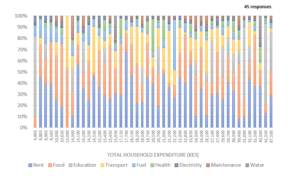
Fig 16: Proportion of monthly expenditure by category for each household in previous home
Of the 9 categories detailed in Fig 16, rent was generally the largest expenditure, followed by food, education and transport. As a percent of household income, rent ranged from 10% all the way through to just under 70%; percentages were not correlated with income.
We can compare the mean KKL expenditure data to that collected from the census, covering the full census dataset and then the breakdowns for each targeted segment [7] within CAHF and 71point4’s analysis [8]. This is a useful lesson, as the census work incorporates more groupings than the household survey work does. Across all census segments, these additional groups [9] were 30% of all total expenditure (ranging from 27% for segment 1, to 34% for segment 2).
‘KKL (Revised)’ in Fig 17 assumes that the KKL survey data failed to capture an equivalent 30% of expenditure, adjusting the figures down by 30%. This puts spending on education, water/electricity/fuel, health, and maintenance in a broadly similar position to the census data, but rent remains significantly higher for KKL residents (20%) than the general population (12%), and food significantly lower (16% vs 36%).
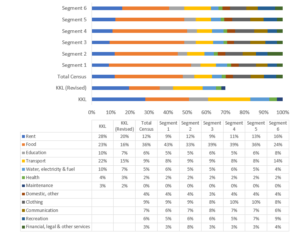
Fig 17: Mean Percentage Spent on Each Expenditure Group, Comparing KKL and Census Data
Fig 18 uses a box and whisker diagram to show the spread of expenditure in Kenyan Shillings (KES) across each category [10]. Overall, rent was the largest expenditure, with a median of KES 5,000/USD 34 (KES 3,000 at 25th percentile, KES 8,500 at 75th percentile) in respondents’ previous home. In the new homes, rent ranged between KES 9,000/ USD 60 and KES 10,000/USD 67. Food and transport were the other two large costs, with a median of KES 4,750/USD 32 (KES 2,500/KES 6,375) for food and KES 3,000/USD 20 (KES 1,200/KES 4,950) for transport. Education had the broadest range, with the 25th percentile and median both at zero, but the 75th percentile spending KES 3,000/USD 20, and some spending far beyond this.
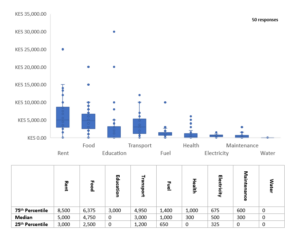
Fig 18: Average proportion of expenditure by category in previous home
Access to finance
Households had generally never accessed loan finance; 66% of KKL clients have never taken out a loan. For those that have, 71% have loans that are still active. Only three of the 17 responses said that their loan was for home construction. These loans were received from a combination of formal (bank or microfinance institution) and informal sources, with business and education being the most common uses for the funds.
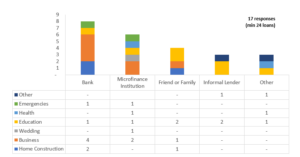
Fig 19: Number of loans received by type and purpose
Satisfaction
Respondents were asked the extent to which they agree to a variety of questions, a selection of which are shown here.
Generally, respondents’ new homes were seen as an improvement in terms of location compared to where they were living previously, with moderate improvements in score for jobs and workplaces, and more minor improvements for schools, clinics, and local markets.
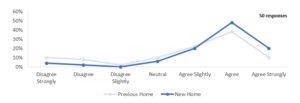
Fig 20: “Our home is in a good location for workplaces/jobs”
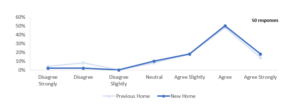
Fig 21: “Our home is in a good location for schools, clinics and local markets”
There is limited change between previous and new homes in terms of households feeling under threat of eviction. Similar to the data on previous housing conditions, this suggests that residents were generally living in basic but formal housing before.
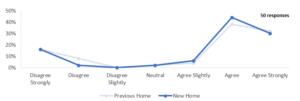
Fig 22: “Where we live, we don’t feel under threat of eviction”
Sharing data and collaborating with all sector actors is vital if we want to make housing markets work. We encourage landlords in Kenya to use our data collection tool to collect data on their residents to better understand their situations, and the opportunity to provide improved housing conditions. For more information, please contact Beatrice Mwangi on [email protected].
CAHF, Reall and FSD Kenya have co-founded the Open Access Initiative, a pioneering approach to data sharing and collaboration in affordable housing markets. To learn more about our work in Kenya under the initiative, click here.
![]()
![]()

References:
[1] CAHF (2022) Positioning affordable and backyard rental housing as a key target in Kenya’s Affordable Housing Programme (DRAFT Findings). https://housingfinanceafrica.org/documents/positioning-affordable-and-backyard-rental-housing-as-a-key-target-in-kenyas-affordable-housing-programme-draft-findings/
[2] Note that the statistics included in this article are all based on the 2019 Census for Kenya.
[3] Kenya National Bureau of Statistics (2019) 2019 Kenya Population and Housing Census. https://www.knbs.or.ke/2019-kenya-population-and-housing-census-results/#:~:text=The%202019%20Kenya%20Population%20and,adoption%20of%20use%20of%20technology.
[4] The household survey used formal employment, informal employment, business, housewife/husband, retired and other, while the census analysis was split into employed (private sector: full time), employed (private sector: part time), employed (public sector), working in own business, casual or seasonal worker, not employed.
[5] Kenya National Bureau of Statistics (2019) 2019 Kenya Population and Housing Census. https://www.knbs.or.ke/2019-kenya-population-and-housing-census-results/#:~:text=The%202019%20Kenya%20Population%20and,adoption%20of%20use%20of%20technology.
[6] See Previous Expenditure section for more detail
[7] Segment 1: Renter households in informal areas in dwellings built of non-durable materials.
Segment 2: Renter households in informal areas in dwellings built of durable materials.
Segment 3: Renter households in formal areas in dwellings built of non-durable materials.
Segment 4: Renter households in formal areas in dwellings built of durable materials with non-flush sanitation.
Segment 5: Households in formal areas in dwellings built of durable materials with a flush toilet that is shared with others.
Segment 6: Households in formal areas in dwellings built of durable materials with a flush toilet that is not shared with others.
[8] CAHF (2020) 2019 Kenya Population and Housing Census Reports. https://housingfinanceafrica.org/documents/2019-kenya-population-and-housing-census-reports/#:~:text=From%20this%20report%2C%20Kenya’s%20population,land%20area%2C%20and%20population%20density.
[9] Covering ‘Domestic, other’, ‘Clothing’, ‘Communication’, ‘Recreation’, and ‘Financial, legal & other services’.
[10] The bottom of the ‘box’ represents the 25th percentile figure, with the top being the 75th percentile and the line through the middle of the box, the median (50th percentile). The ‘whiskers’ represent variability outside of these quartiles (1.5x the interquartile range), while the circles represent each individual datapoint.
Read more stories

How Affordable Homes could help solve the global climate crisis
The United Nations climate summit, COP25, starts today in the Spanish city of Madrid where climate leaders will push to scale up action and investments into rapidly reducing global greenhouse gas emissions and support broader sustainable development agendas, specifically addressing …
Celebrating affordable housing in Beira
The ribbon-cutting ceremony was attended by Reall’s Director of Investment and Operations Patrick Domingos-Tembwa, Mayor of Beira Daviz Simango and Casa Real Director Marie Odile. The celebration was particularly poignant as these homes managed to withstand the destruction of Cyclone…

New Partnership: Syntellect
Reall are delighted to be partnering with India-based technology firm, Syntellect. Syntellect are committed to giving unbanked people the opportunity to access mortgage finance across Africa and Asia. Syntellenct has created RightProfile, a customer profiling platform designed to help lenders …