Understanding the tenants of Fusion Capital’s rental properties in Nairobi, Kenya
The following article is co-written by Dr. Hannah Jayne Robinson (Monitoring, Research and Evidence Coordinator at Reall), Beatrice Mwangi (Research Manager at the Centre for Affordable Housing Finance in Africa) and Ben Atkinson (Programme Lead – Data and Evidence at Reall) as part of their partnership under the Data Agenda for Housing in Africa. This blog follows a similar analysis of Kwangu Kwako projects, which can be found here.
With home ownership at only 21.3%, the Nairobi housing market is predominantly rental [1], with an estimated 75% of the employed population earning below Kshs 50,000 (US$ 440) per month [2]. In many cases, households must seek other income sources additional to the main income earner’s monthly income, to support their daily expenditure which includes education and medical expenses.
In 2021, FSD Kenya, Reall, and the Centre for Affordable Housing Finance in Africa (CAHF), partnered with Fusion Capital and Kwangu Kwako Limited, who have residential rental projects in Nairobi, with the aim of understanding their tenants and the larger Kenyan rental market.
This article focuses on tenants in homes delivered by Fusion Capital, summarising results from 72 survey respondents (55 baseline and 18 follow-up). This limited number of responses does not effectively profile low-income households; the sample is entirely inadequate for this. However, it does give a useful indication of the types of clients that Fusion Capital is reaching. Each question will also specifically mention how many of the 72 respondents answered that specific question.
Fusion Capital is a private equity firm focused on real estate investment and fund management based in East Africa. Fusion has been developing real estate in east Africa for over 10 years, delivering over 1 million sqft of property across the commercial, residential and hospitality sectors. This portfolio includes three residential rental projects in Kenya; Ubuntu Palm Apartments, in Githurai; Montey Apartments in Nakuru County, and Graceland in Athi River. Some units in these last two were of these projects were made available for sale [3].
Tenant surveys were undertaken to understand household characteristics, income levels, household expenditure, savings culture, education levels among other key data points. This blog examines the characteristics of households within these projects, with a focus on household size, gender distribution, employment and household expenditure. The data has been provided under the Open Access Initiative and drives the Data Agenda for Housing in Africa.

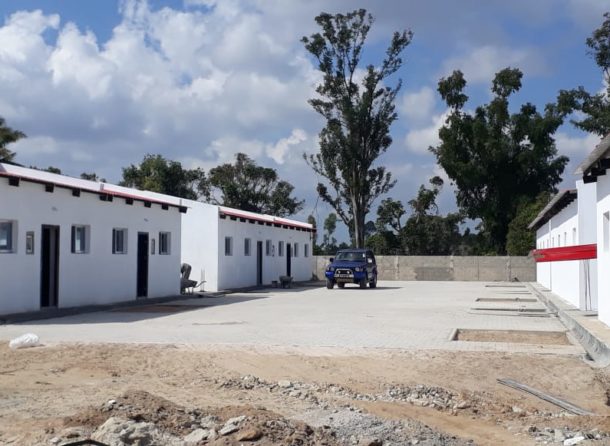
Image 1 and 2: Ubuntu Palm Apartments by Fusion in Githurai: Has 38 units, it has 26 studios and 12 single bedroom units renting at KES 7,000 and KES 12,000 per month. The ground floor has 4 roadside shops renting between KES 8,000 and KES 12,000 per month. Ubuntu Palms is situated within the dense, multi-storey walk-up settlement in Githurai, a suburb of Nairobi. The area is densely populated, with poor municipal services and road infrastructure.
Household demographics
The demographic data collected highlights key characteristics of this tenant group. The group was almost evenly split by gender, with 46% women and 54% men. Most lead tenants are young adults, with 61% aged between 20 and 30, and another 28% aged between 31 and 40, indicating a largely youthful population.


Fig 1: Gender of Respondent Fig 2: Age of Lead Tenant
Education levels were notably high, with 62% having completed university degrees, and an additional 26% having some university education. Only a small percentage had limited formal education, with 2% reporting no schooling at all. The tenants’ marital statuses were evenly divided: 48% were single at the time of the survey, while another 48% were married or cohabitating, and a small 4% were separated or divorced.


Fig 3: Highest level of education of respondent Fig 4: Marital status of respondent
Interestingly, shifts in household sizes between previous and new homes were apparent. While 30% lived alone in their previous homes, this number rose significantly to 50% in their current affordable housing units.
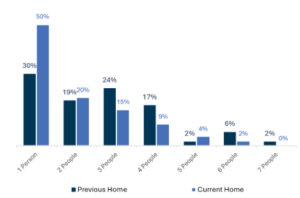
Fig 5: Household Size?
Employment and income levels
One fifth of respondents (20%) were formally employed, with another 15% of the sample identifying as business owners. Just under half (44%) were informally employed, 2% were housewives/househusbands, 13% stipulated they were unemployed, and 6% stated ‘other’.

Fig 6: What is the employment status of the main income earner
Those in formal employment have jobs in management, accounting, sales, information technology or were health professionals. Those employed in informal employment have jobs in information technology, beauty, entertainment, sales, transport or stated general business.

Fig 7: What is the main income earner’s monthly income from their main job? (In Kshs)
The mean main income earner’s monthly income in the baseline study was Kshs 29,296 (US$ 230), this rose to Kshs 35,833 (US$280) in the follow up survey. The graph below illustrates the composition of the main earner’s monthly income among the households, by income band. The mean total monthly income for the whole household was 105,000 (US$ 810), however this was only answered by 3 households (60,000 | 60,000 | 195,000) so is likely unrepresentative of all the tenants.

Fig 8: Have you ever taken out a loan?
The survey revealed that only 19% of tenants had ever taken out a loan, with 15% still actively repaying and 4% having fully paid off their loans, while the majority (81%) had never accessed formal or informal credit. Among those who borrowed, banks were the primary source, accounting for 60% of loans, with friends or family providing 10%, informal lenders providing 10%, and other sources accounting for 20%. The purposes for borrowing varied, with 40% of loans directed toward business ventures or emergencies, with 10% used for education expenses, and the final 10% for home construction. This data highlights both the limited reliance on credit among tenants and a strong tendency to prioritize loans for income-generating activities or urgent needs over long-term investments like housing.


Fig 9: If you have taken out a loan, what was this for? Fig 10: If you have taken out a loan, who provided this loan?
Water and Sanitation
All tenants in Fusion properties now enjoy the significant upgrade of running piped water and safely managed sanitation through in-house toilets, marking a notable improvement from their previous living conditions. Due to the inconsistency of council water, Fusion has also connected the projects to local boreholes.
Before moving into Fusion properties, 80% of tenants had access to private toilets, either in-house or on-plot, but 19% still relied on shared sanitation facilities. Waste management practices varied widely, with over half of respondents (54%) unaware of how their waste was disposed of. Among those who did know, 28% cited offsite disposal systems such as sewers, while others depended on onsite solutions like bio-digesters (4%) or pit latrines (13%).
In their previous homes, 78% of tenants had private access to water (in-house or on-plot), but 20% shared facilities, and one respondent (2%) lacked access to nearby taps altogether. Municipal pipes were the most common water source (55%), followed by private water pipes (27%), while 6% relied on wells, boreholes, or water vendors. These findings highlight the improvements in water and sanitation services tenants experience upon moving to Fusion properties.


Fig 11: What kind of sanitation provision did your previous home have? Fig 12: How was the sanitation waste from your previous home disposed of?
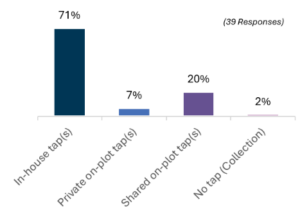

Fig 13: What kind of water provision did your previous home have? Fig 14: Where was your previous home’s water sourced from?
Occupancy
Since moving into Fusion, residents security of tenancy has increased; prior to moving into their new homes, only 35% of respondents had a tenancy agreement in place. As 95% of respondents previously lived in rented accommodation (either as an individual (76%) or with others (19%)), this indicates a significant gap in formal agreements that could have safeguarded their tenure. The introduction of tenancy agreements in Fusion properties not only enhances legal protections for residents but also fosters a greater sense of stability and trust in their living arrangements. Fusion tenants also have access to a “Tenant Handbook” (attached below) which explains both their rights and responsibilities as tenants of the building.

Fig 15: Did you have a written tenancy agreement for your previous home?
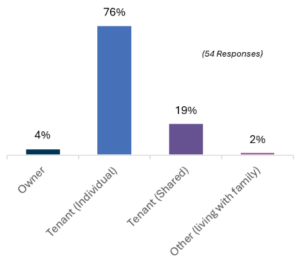
Fig 16: Where was your previous home’s water sourced from?
Household expenditure

Fig 17: Total Household Expenditure, plotted in Quartiles (Kenyan Shillings)
Household expenditure among tenants varied widely, reflecting the diverse income levels amongst the residents. In previous homes, tenants were spending between KES 8,000 and KES 130,400, with the mean expenditure totalling KES 20,300. On average, monthly spending increased slightly with a mean expenditure of KES 23,450. Expenditure ranged from KES 12,600 to a maximum of KES 85,000 across the whole sample, showing a decrease in the extremes of the spending, but a general trend in increases expenditure across the minimum and interquartile range. Most households fell within an interquartile range of KES 16,335 to KES 36,150.
The survey shows a slight decrease in the proportion of tenants who found the development affordable. This is likely due to a rise in expenditure on rent when tenants moved into the Fusion property; in their previous property, only 15% of people paid more than 10,000 KES, however now 56% of tenants pay between 10,000 – 15,000 KES. Additionally, the total average expenditure by households across the 9 categories has risen from 24,400 KES to 30,800 KES (a rise of $41 USD). The figures are also given in box plot formation to capture the spread of expenditure across the categories.
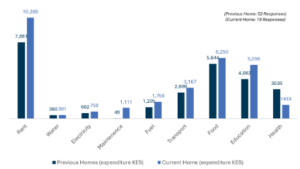
Fig 18: Average expenditure for households (Kenyan Shillings)
Although tenants now spend more across each of the 9 categories, the proportion of expenditure that was designated to each of the categories (Rent, Water, Electricity, Maintenance, Fuel, Transport, Food, Education, and Health) differed only slightly when moving into the Fusion properties, with small increases to the proportion of total expenditure more being spent on Rent, Maintenance, Fuel and Education.

Fig 19: Proportion of expenditure by category (Previous home) Fig 20: Proportion of expenditure by category (Current home)
The following figures record the proportion of expenditure spent across the specified categories at the individual household level. These individual level charts demonstrate how expenditure changes across income levels, with some categories remaining consistent (health and food), and other varying significantly (education). The individual graphs reveal that only the higher earning households are spending on education, with no household earning less than 26,700 KES spending anything towards education, as illustrated below:
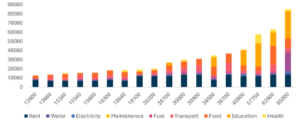
Fig 21: Expenditure breakdown per household in new property (Kenyan Shillings)

Fig 22: Proportion of income spent across each category household in new property (Kenyan Shillings)
Satisfaction
The survey revealed positive increases in housing satisfaction across several critical factors, showing that tenants in the Fusion property are experiencing notable improvements in key areas of their living conditions compared to their previous homes. Questions on satisfaction were ranked on a 7-point scale from “disagree strongly” to “agree strongly,” with the following figures reflecting those who responded with “agree” or “agree strongly” to each factor.
Satisfaction with location convenience for workplaces and job access rose from 78% in previous homes to 88% in current homes, while access to schools, clinics, and markets increased from 82% to 89% (calculated using the proportion of respondents choosing ‘agree slightly’, ‘agree’, and ‘agree strongly’).

Fig 23: Is your house positioned in a good location for Workplaces and Jobs

Fig 24: Our house is positioned in a good location for schools, clinics and local markets
However, while tenants generally found their previous homes affordable (79%), satisfaction with affordability slightly decreased to 72% in the new housing, but this is possibly due to increased rental costs determined by improved quality and amenities. Notably, there was a significant rise in satisfaction with the number of rooms, jumping from 62% to 89%, and an even larger increase in perceptions of construction quality—from 50% in prior homes to 83% in the new housing, marking it as the most substantial improvement. Additionally, feelings of security around eviction remained relatively stable, moving slightly from 64% to 66%.
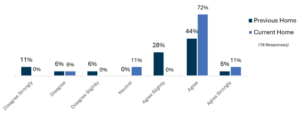
Fig 25: My home is designed and constructed to a high quality

Fig 26: The number of rooms in my house is adequate for my household needs and size
Overall satisfaction of tenants has dramatically increased after moving into their new properties. Previously, 43% of residents were on average unsatisfied with their lives choosing to 0-5 on the scale of 0-10, with 0 being completely unsatisfied. Since moving into the Fusion property, 100% of tenants stipulated that on average they feel satisfied, with 44% stating 9 on the 0-10 scale (with 10 being completely satisfied).

Fig 27: On a scale of 0 to 10, how satisfied are you with your life overall?
These findings suggest that while affordability remains a concern, the overall gains in location, space, and quality underscore the positive impact of affordable housing developments on tenants’ satisfaction and well-being.
It is also worth noting that, over time, tenants’ perceptions of their previous housing shifted significantly after living in Fusion Properties for six months. When reflecting on their past homes, respondents consistently rated their previous satisfaction levels much lower than they had initially. For instance, one anonymized respondent, Resident A, initially rated their satisfaction with life in their previous home as 9/10, but at the six-month follow-up, revised this to 5/10. Similar trends were observed among other tenants, with initial ratings of 10, 8, and 8 dropping to 5, 4, and 3, respectively. This shift highlights how the improvements in their current housing reshaped their perspective, making them reevaluate the limitations of their previous living conditions.
Conclusion
In summary, the survey highlights the positive shifts experienced by tenants in affordable housing, reflecting improvements in satisfaction with living conditions, despite some adjustments in affordability. Tenants report better access to workplaces, schools, and essential services, and significant gains in the quality and space of their homes have led to increased satisfaction. Employment and income diversity suggest a resilient tenant community, with income levels influencing expenditure patterns across rent, education, and other essential needs. While higher rent costs are a challenge for some, tenants report a considerable improvement in their overall quality of life and well-being, underscoring the positive impact of the Fusion properties on their housing experience. This is further evidenced by shifts in satisfaction perception, as many tenants now view their previous housing more critically after experiencing the benefits of their new homes.
![]()
![]()

Questionnaire for Understanding the tenants of Fusion Capital’s rental properties in Nairobi, Kenya
References:
[1] Centre for Affordable Housing Finance in Africa (CAHF). Housing Finance in Kenya. https://housingfinanceafrica.org/countries/kenya/
[2] Global Partnership for Sustainable Development Data (2022). Beyond the top 1% of Kenyans and the employed, there are Kenyans who don’t exist (2021). https://www.data4sdgs.org/news/beyond-top-1-kenyans-and-employed-there-are-kenyans-who-dont-exist
[3] Fusion’s ‘build and sell’ units are about 60 SQM and 148 SQM for a two and three-bedroom, priced at approximately Kshs 6.5 mn (US$ 57 200), and Kshs 12.5 mn (US$ 110 000), respectively, and are targeted at middle to high income tenants. While Fusion Capital has traditionally served this middle to high income market segment, the Ubuntu Palm Apartments project featured in this survey targets low-income households.
This article is part of an ongoing series, which began with our previous publication, Understanding the Tenants of Kwangu Kwako Ltd’s Rental Properties in Nairobi, Kenya. Read the previous article here.
Read more stories

How Affordable Homes could help solve the global climate crisis
The United Nations climate summit, COP25, starts today in the Spanish city of Madrid where climate leaders will push to scale up action and investments into rapidly reducing global greenhouse gas emissions and support broader sustainable development agendas, specifically addressing …
Celebrating affordable housing in Beira
The ribbon-cutting ceremony was attended by Reall’s Director of Investment and Operations Patrick Domingos-Tembwa, Mayor of Beira Daviz Simango and Casa Real Director Marie Odile. The celebration was particularly poignant as these homes managed to withstand the destruction of Cyclone…

New Partnership: Syntellect
Reall are delighted to be partnering with India-based technology firm, Syntellect. Syntellect are committed to giving unbanked people the opportunity to access mortgage finance across Africa and Asia. Syntellenct has created RightProfile, a customer profiling platform designed to help lenders …