Understanding the Urban Bottom 40%
Data is the cornerstone of a green affordable housing movement. There is a dearth of data within the emerging markets in which we operate, which creates a negative impact on policy and investment in green affordable housing for families living on low incomes.
Reall have partnered with the Centre for Affordable Housing Finance in Africa (CAHF) and local in country organisations to kickstart a data revolution to disrupt the market and unlock investment for impact. Together we have have launched the Market Shaping Indicators (MSIs), an open access approach to sharing public sector housing market data.
It’s true that data for families on low incomes in the informal sector does exist, but it is invisible right now because it’s not known or not shared publicly, because it is blocked by intellectual property rights or because no-one takes responsibility to share it. Reall and our partners want to change this.
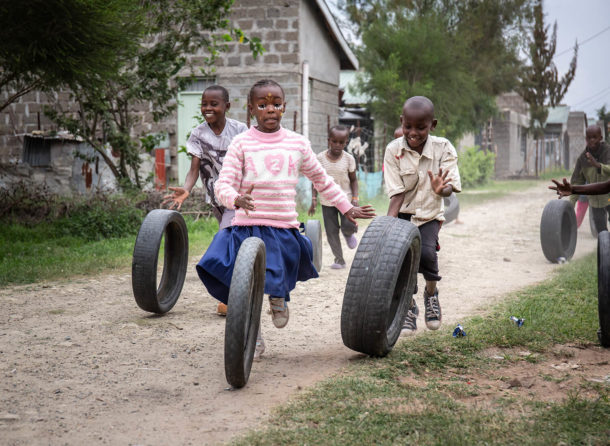
Reall is an innovator and investor in green affordable housing in urban Africa and Asia, targeting the urban bottom 40% of the income pyramid (UB40).
We know that making data visible allows investment to have more impact for people living on low incomes. It means transparent policy, which leads to effective policy, and it will spark innovation and transform the sector on behalf of those people who are currently locked out.
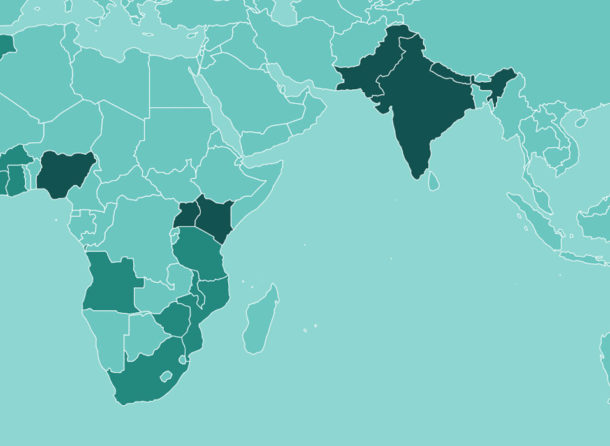
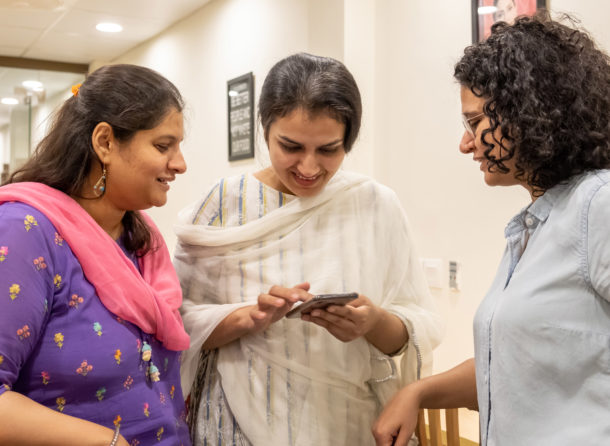
Reall are sharing with you the insights we have gained from gathering household data from India, Pakistan, Nigeria, and Uganda to shed light on what UB40 looks like in each of these contexts.
Income data is captured from specific household and income surveys undertaken by each country’s statistics bureau, while all other data comes from the Demographic and Health Survey (DHS) programme, a standardised international framework that is then implemented by national statistics bureaus.
Read our UB40 Factsheets
 |
 |
Understanding the Urban
|
Understanding the Urban
|
 |
 |
Understanding the Urban
|
Understanding the Urban
|
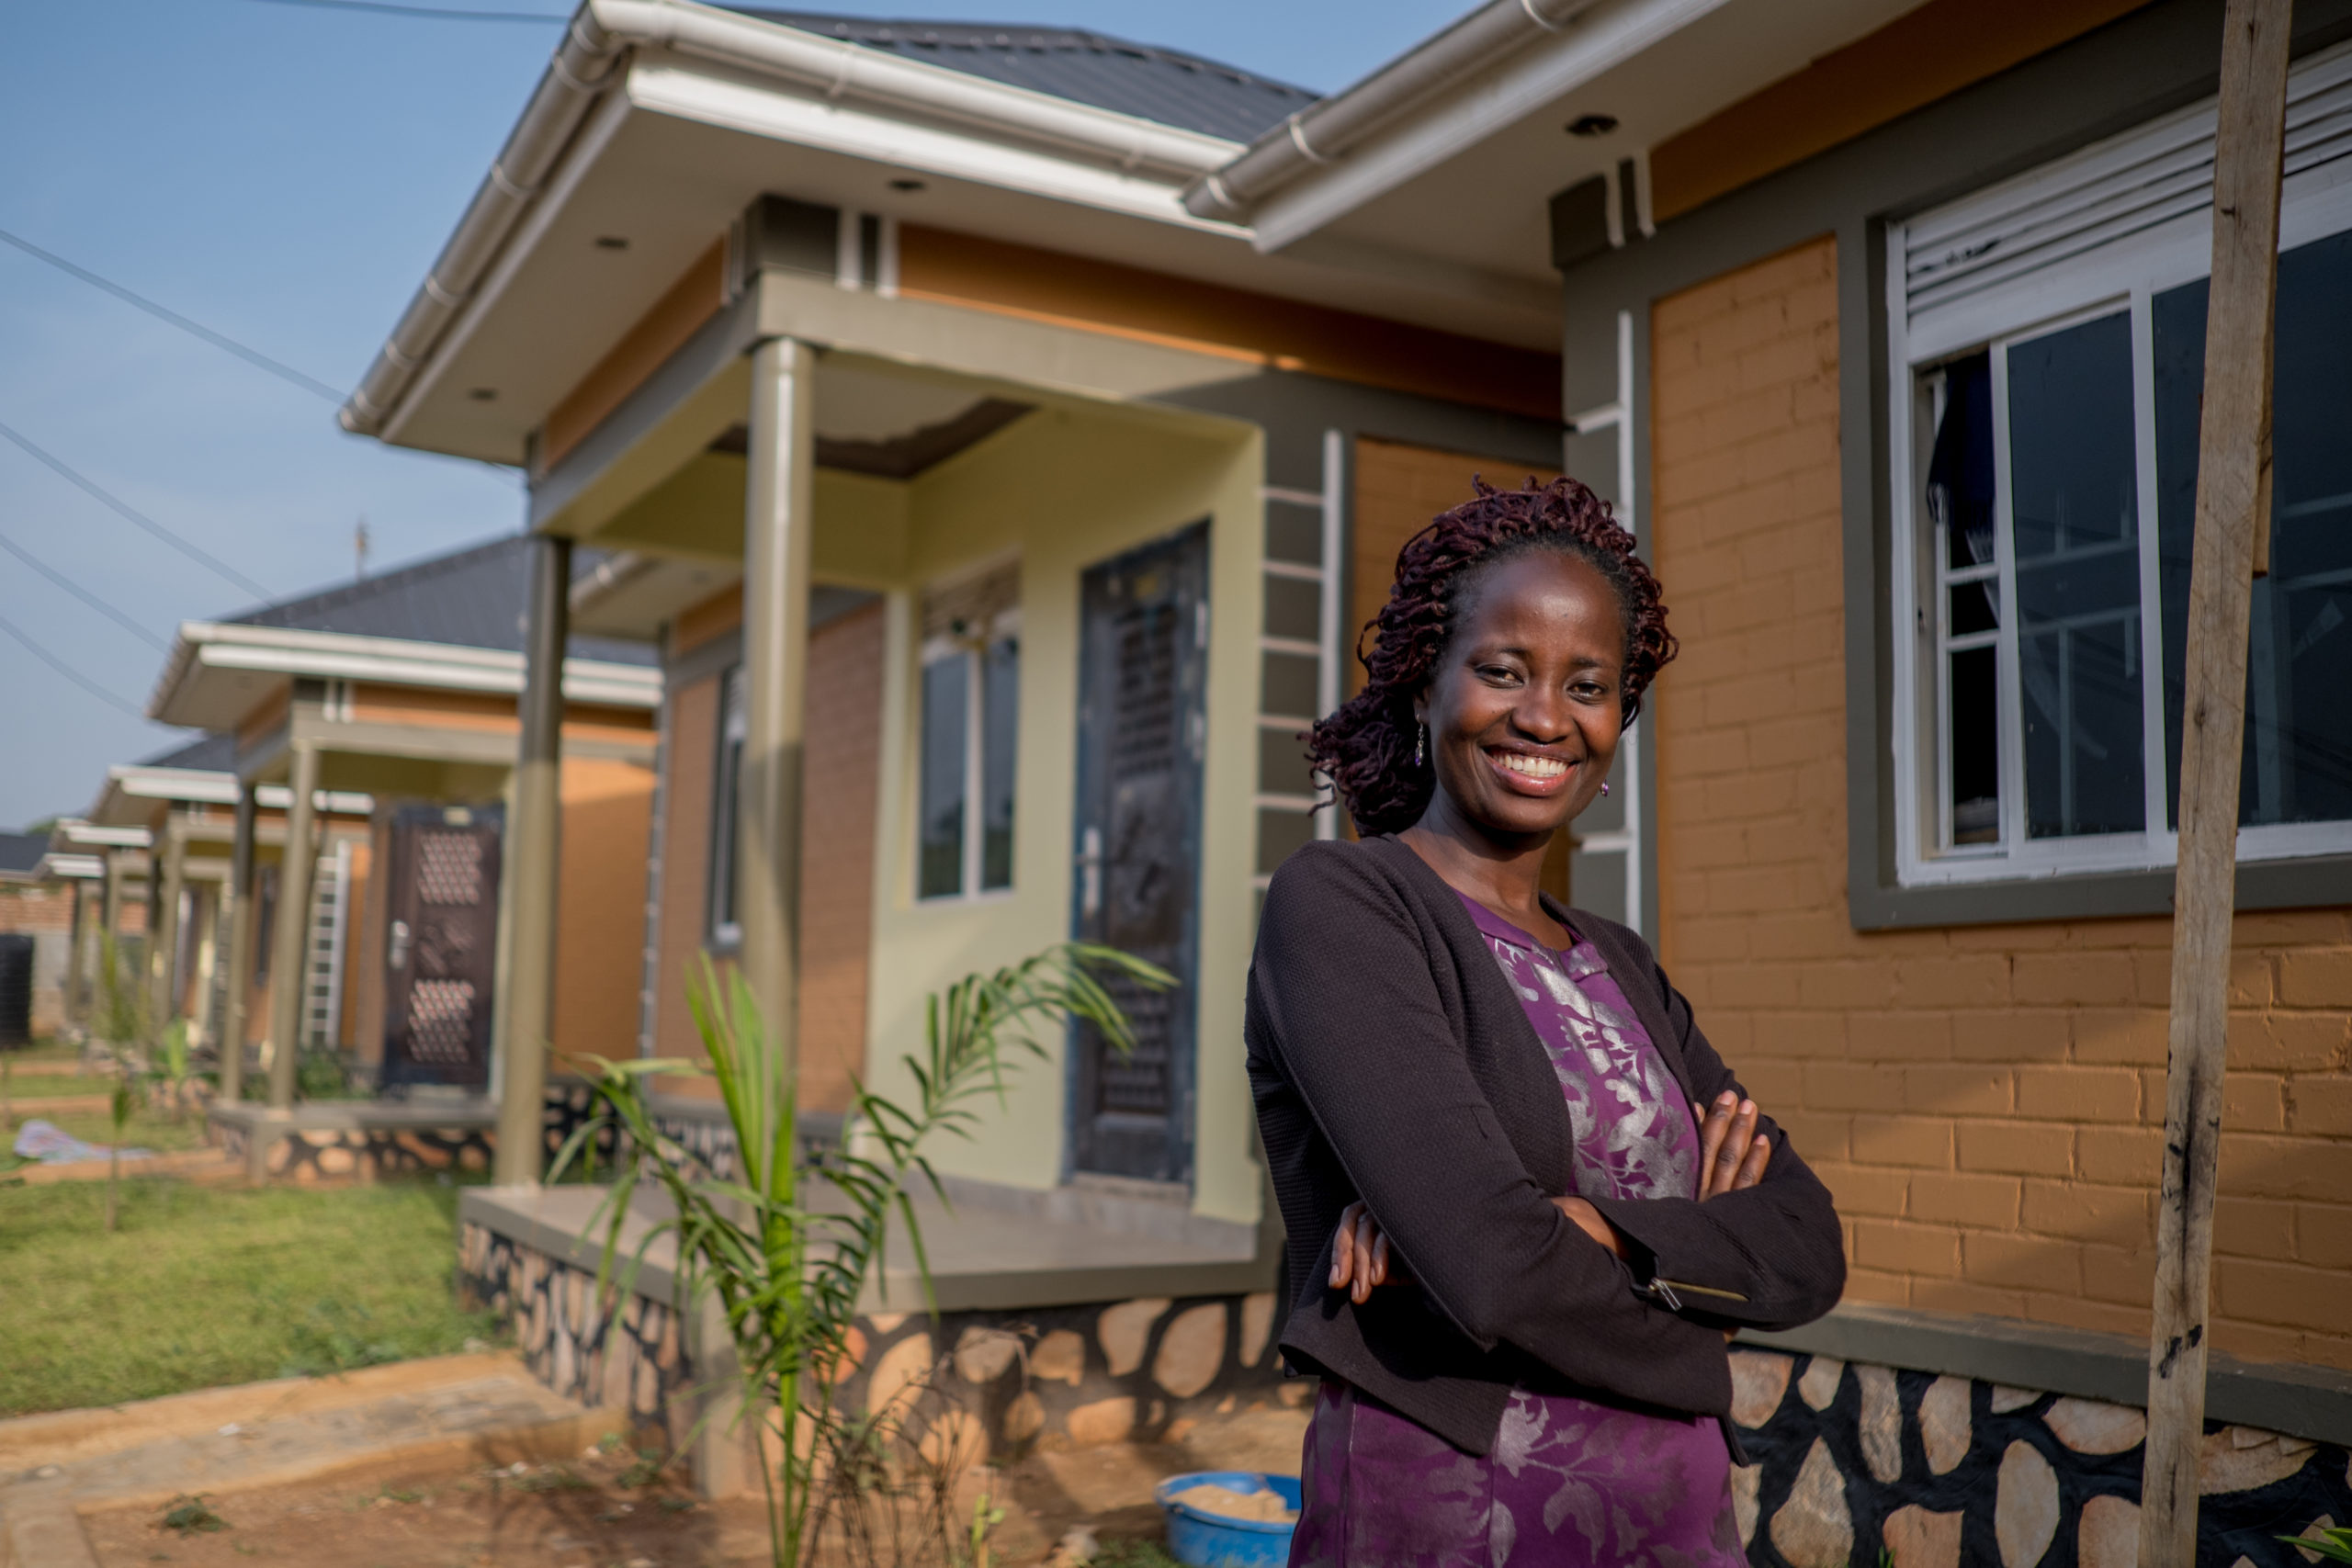
Housing conditions
Household sizes vary significantly across countries, with one-third of UB40 households in Uganda and Nigeria consisting of two people or less, compared to just 7% in Pakistan. Furthermore, 45% of Pakistani UB40 households have seven or more members. With 40-50% of UB40 homes in all four countries containing just one sleeping room, 68% of Pakistani UB40 households live in overcrowded conditions.
Quality of housing is a particular concern for these income groups, and the absence of this is starkest in Uganda. Just one-third of Ugandan UB40 homes are built with durable walls, and only 4% have access to a water tap within their plot or homes. Interestingly the UB40 in Uganda performs better in terms of access to private sanitation (45%), but this drops to just 22% for those in the 41st-60th percentiles.
One of the starkest differences is in use of cooking fuel. In India and Pakistan, gas is the most popular even in the UB40, but is almost unheard of in Uganda and Nigeria where wood is standard. Across all four countries though, lower income groups are significantly more likely to cook with wood; 40% of Pakistani and 19% of Indian UB40 households cook with wood, but these figures drop to just 5% and 2% respectively for the 41st-60th percentiles.
Assets and inclusion
Female-headed households make up a significant minority of UB40 households in Uganda and Nigeria (35% and 33% respectively), but just 11% in Pakistan.
Within the DHS, male and female respondents report whether they own a home (the one that they live in or another one, either singly or jointly). Across all countries, home ownership was significantly lower for women than for men, but this was lowest in Pakistan where just 2% of UB40 women reported owning a home.
Car ownership remains a small proportion of UB40 households (1-7%) in all countries, but other assets vary significantly across countries. Unsurprisingly, motorbikes are much more common in Asia. More surprisingly though, the same is the case for refrigerators and televisions, both of which form the majority for India and Pakistan, but are uncommon in Nigeria and almost unheard of in Uganda.
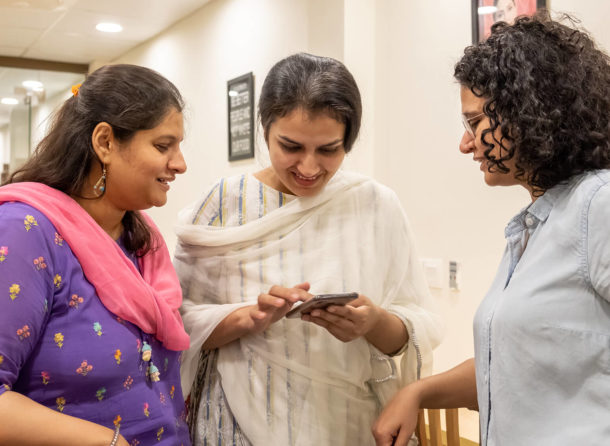
Finally, access to bank accounts is low everywhere except India (93%), but in Uganda use of mobile money provides a common alternative (used by 70% of UB40 men and 64% of UB40 women).
Incomes and employment
A standardised approach to sharing income data remains out of reach, making direct comparisons difficult. Furthermore, effectively measuring household incomes is notoriously challenging, and the accuracy of data from national sample surveys is not confirmed, but it does act as a useful guide.
- In India, data suggests that UB40 households in the largest cities are earning a maximum of approx. INR 13,500-15,000 per month (approx. $180-200).
- Data for Pakistan currently does not enable city-specific views, instead aggregating at Urban Province level with figures of PKR 31,000-40,000 (~$170-220) for urban residents of each province.
- In Uganda, the median (50th percentile) household income for Uganda is listed as UGX 667,000 ($190), dropping to UGX 436,000 ($125) for the national urban population.
Within the labour market, there are considerable differences in the proportion of women working; 74% of UB40 women in Uganda aged 15-49 are currently working, compared to 66% in Nigeria, 26% in India and just 14% in Pakistan.
Join us at WUF11 for a deep dive into disruptive data at our session: Affordability and Data: Unlocking affordable housing markets through a data revolution.
Read more stories
How Affordable Homes could help solve the global climate crisis
The United Nations climate summit, COP25, starts today in the Spanish city of Madrid where climate leaders will push to scale up action and investments into rapidly reducing global greenhouse gas emissions and support broader sustainable development agendas, specifically addressing …
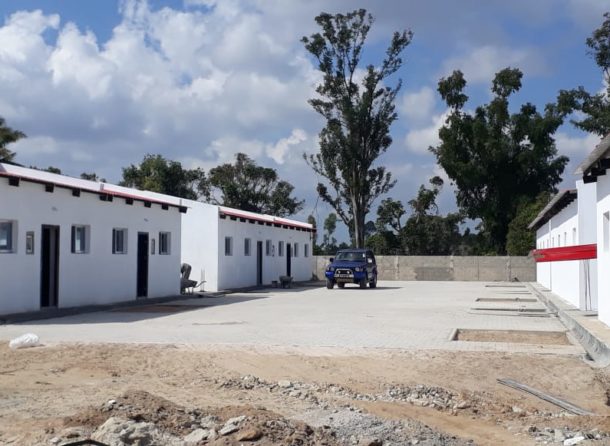
Celebrating affordable housing in Beira
The ribbon-cutting ceremony was attended by Reall’s Director of Investment and Operations Patrick Domingos-Tembwa, Mayor of Beira Daviz Simango and Casa Real Director Marie Odile. The celebration was particularly poignant as these homes managed to withstand the destruction of Cyclone…
New Partnership: Syntellect
Reall are delighted to be partnering with India-based technology firm, Syntellect. Syntellect are committed to giving unbanked people the opportunity to access mortgage finance across Africa and Asia. Syntellenct has created RightProfile, a customer profiling platform designed to help lenders …