Launching Reall’s New Kenya Housing Affordability Dashboard
Across the countries in which Reall works, we see housing markets that predominantly (or even exclusively) focus on the highest income groups, ignoring middle- and lower-income households. Developed with support from Warwick Business School, Reall’s new Kenya Housing Affordability Dashboard builds on Reall’s previous work exploring household income data from national statistical offices (see Household Income and Affordability Calculator), to provide a visual, data-driven picture of affordability across the Nairobi Metropolitan Area.
The Dashboard takes country-specific household consumption data (used as a proxy for income) from the Kenya Continuous Household Survey 2021 (Kenya National Bureau of Statistics) and plots this for each income percentile in the selected county.
It then overlays house price data from over 1,000 housing projects presented within the Centre for Affordable Housing Finance in Africa’s (CAHF’s) Housing Developments in Nairobi Metropolitan Area Dashboard, using basic loan and affordability parameters to calculate which income groups are served by Nairobi’s formal housing market and which ones are ignored.
The data tells a striking, but unsurprising story. Even with supportive terms, e.g. a 25-year mortgage at 9% interest, a 20% deposit, and 30% of income spent on housing, less than 4% of the homes identified in Nairobi County are affordable to the Bottom 80% of the income pyramid; 48% are only affordable to those in the 99th percentile.

By changing the terms, we can see the impact on housing affordability. For example, heavily subsidised lending at a 5% interest rate would bring 14% of homes within reach of that same Bottom 80%, and reduce the total affordable to only the 99th percentile to 34%.

Even with these subsidised terms, there is a huge portion of the market that is simply not catered to by formal housing developers. By supporting housing developers to better target these income groups, through subsidies, concessional finance, and new approaches to design and construction, we can unlock viable new markets, create jobs and economic growth, mitigate and build resilience to climate change, and truly transform people’s lives.
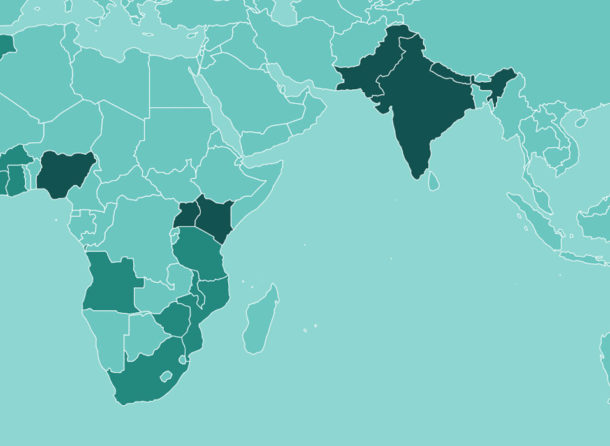
This work builds on Reall’s Household Income & Affordability Calculator, which presents raw data from National Statistical Offices to build an understanding of household incomes within districts, counties and states across 11 countries in Africa and Asia. This sits alongside other open-access tools such as the Market Shaping Indicators and Reall’s Projects Dashboard, developed to help stakeholders understand affordable housing markets, and the opportunities and challenges within them.
Warning: Income/expenditure data are notoriously unreliable, particularly for wealthier groups, and it is likely that the data underestimates incomes at the top of the income pyramid. This calculator is not attempting to provide definitive figures, but a rough estimation.
This blog was written by Ben Atkinson (Programme Lead – Data and Evidence)
Read more stories

How Affordable Homes could help solve the global climate crisis
The United Nations climate summit, COP25, starts today in the Spanish city of Madrid where climate leaders will push to scale up action and investments into rapidly reducing global greenhouse gas emissions and support broader sustainable development agendas, specifically addressing …
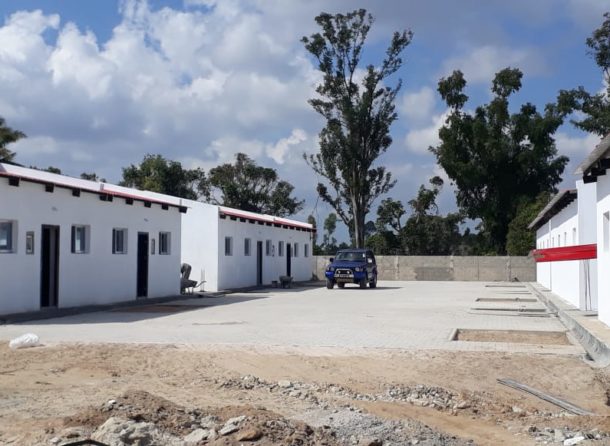
Celebrating affordable housing in Beira
The ribbon-cutting ceremony was attended by Reall’s Director of Investment and Operations Patrick Domingos-Tembwa, Mayor of Beira Daviz Simango and Casa Real Director Marie Odile. The celebration was particularly poignant as these homes managed to withstand the destruction of Cyclone…

New Partnership: Syntellect
Reall are delighted to be partnering with India-based technology firm, Syntellect. Syntellect are committed to giving unbanked people the opportunity to access mortgage finance across Africa and Asia. Syntellenct has created RightProfile, a customer profiling platform designed to help lenders …